
MATLAB: An Introduction with Applications
6th Edition
ISBN: 9781119256830
Author: Amos Gilat
Publisher: John Wiley & Sons Inc
expand_more
expand_more
format_list_bulleted
Related questions
Question
Find Solution:
1. Data:
2. Assumption:
3. Hypothesis:
4. Test statistic:
5. Decision Rule:
6. Decision:
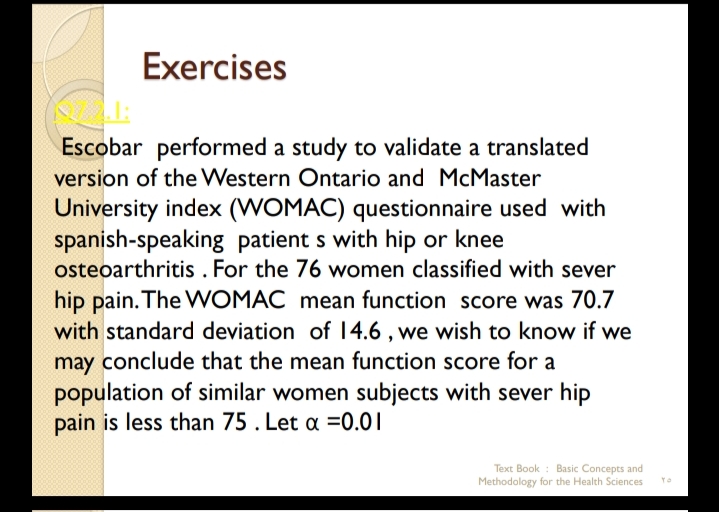

Transcribed Image Text:Exercises
Escobar performed a study to validate a translated
version of the Western Ontario and McMaster
University index (WOMAC) questionnaire used with
spanish-speaking patient s with hip or knee
osteoarthritis . For the 76 women classified with sever
hip pain. The WOMAC mean function score was 70.7
with standard deviation of 14.6 , we wish to know if we
may conclude that the mean function score for a
population of similar women subjects with sever hip
pain is less than 75 . Let a =0.01
Text Book : Basic Concepts and
Methodology for the Health Sciences
Expert Solution
This question has been solved!
Explore an expertly crafted, step-by-step solution for a thorough understanding of key concepts.

Step by stepSolved in 2 steps with 9 images

Knowledge Booster

Similar questions
- Drop down options are as follows: a. z test or t test b. u or p, <,>,= or not equal to c. z or tarrow_forwardWe have 2 flavors of cough syrup - PLAIN and SWEET. Taste tests are conducted with tasters rating the syrup on a 10 point scale with 1 as bad and 10 as excellent. Data are: PLAIN:7,7,6,5,6,8,5,4,6,8,9,10,5,6,4,8,8,8,9,7,8,9,6,7,8,6,7,8,5,6,5,6,7,8,9,9 SWEET: 1,6,7,7,8,5,4,4,6,9,9,9,8,7,8,7,8,5,10,6,6,7,8,8,8,5,6,4,5,6,7,8,3,4,5 Decide what approach would fit here, conduct your analysis, and draw conclusions.arrow_forwardAnalyze Valley Hospital's admissions time variance Valley Hospital began using standards to evaluate its Admissions Department. The standard was broken into two types of admissions as follows: The unscheduled admission took longer because name, address, and insurance information needed to be determined and verified at the time of admission. Information was collected on scheduled admissions prior to admitting the patient, thus requiring less time in admissions. The Admissions Department employs two full-time people for 40 hours per week at $15 per hour. For the most recent week, the department handled 66 unscheduled and 120 scheduled admissions. a. How much was actually spent on labor for the week? $b. What are the standard hours for the actual volume of work for the week? (Round to the nearest whole hour.) hours c. Compute the direct labor time variance, and report how well the department performed for the week. In your computation, round the standard direct labor rate to the nearest…arrow_forward
- Part I -Explain in your own words the purpose of calculating measures of central tendency for a data set. Provide one (1) example. Part II- Explains the concept of bias, related to the mean, mode, and median. Part III-If you were allowed to choose between the mean, the median, or the mode to calculate the measures to make a decision on a data set, which of the three measures would you use and why? Part IV-Using the data below, compute the mean, mode, and median: 67, 98, 87, 95, 93, 88, 90, 62, 71, 99. Part v-Find the first and third quartiles for a week's temperatures from last year's summer, expressed in degrees Fahrenheit: 82, 90, 93, 88, 91, 96, 87. Part VI-Below is a table of frequencies. Find the mean, mode, and median. Frequency Limits (f) 110-115 15 116-121 22 122-127 19 128-133 20 134-139 9 140-145 21 146-151 11 Part VII- Below are the weight (pounds) data for a group of babies born at Auxilio Mutuo Hospital last month: 5.8, 7.5, 8.0, 6.0, 7.3, 8.1, 6.4, 7.3, 7.2, 6.1, 5.8,…arrow_forwardThe operations manager of a company that manufactures tires wants to determine whether there are any differences in the quality of workmanship among the three daily shifts. She randomly selects 499 tires and carefully inspects them. Each tire is either classified as perfect, satisfactory, or defective, and the shift that produced it is also recorded. The two categorical variables of interest are: shift and condition of the tire produced. The data can be summarized by the accompanying two-way table. Perfect Satisfactory Defective Total Shift 1 106 124 2 232 Shift 2 66 85 3 154 Shift 3 36 74 3 113 Total 208 283 8 499 A) This sample has degree of freedom:��= If shift and quality are independent, thenB) With any expected count accurate to 2 decimal places, the expected count in row 1 column 1 is�1,1= C) With any component accurate to 2 decimal places, the component value in row 1 column 1 of the table iscomponent1,1= D) �2 value of this sample is�2= . Round to 2 decimal…arrow_forwardIdentify the independent variable, the dependent variable, and the unit of analysis in the following hypothesis: families that eat dinner together regularly have closer relationships than those who do not.arrow_forward
- A survey was conducted to determine whether hours of sleep per night are independent of age. A sample of individuals was asked to indicate the number of hours of sleep per night with categorical options: fewer than 6 hours, 6 to 6.9 hours, 7 to 7.9 hours, and 8 hours or more. Later in the survey, the individuals were asked to indicate their age with categorical options: age 39 or younger and age 40 or older. Sample data follow. Age Group Hours of Sleep 39 or younger 40 or older Fewer than 6 38 36 6 to 6.9 60 57 7 to 7.9 76 74 8 or more 66 93 (a) Conduct a test of independence to determine whether hours of sleep are independent of age. (b) What is your estimate of the percentages of individuals who sleep fewer than 6 hours, 6 to 6.9 hours, 7 to 7.9 hours, and 8 hours or more per night?arrow_forwardHow to find independent and defendant variablesarrow_forwardList and explain all three classes of decision making?arrow_forward
arrow_back_ios
SEE MORE QUESTIONS
arrow_forward_ios
Recommended textbooks for you
- MATLAB: An Introduction with ApplicationsStatisticsISBN:9781119256830Author:Amos GilatPublisher:John Wiley & Sons Inc
 Probability and Statistics for Engineering and th...StatisticsISBN:9781305251809Author:Jay L. DevorePublisher:Cengage Learning
 Statistics for The Behavioral Sciences (MindTap C...StatisticsISBN:9781305504912Author:Frederick J Gravetter, Larry B. WallnauPublisher:Cengage Learning
  Elementary Statistics: Picturing the World (7th E...StatisticsISBN:9780134683416Author:Ron Larson, Betsy FarberPublisher:PEARSON
 The Basic Practice of StatisticsStatisticsISBN:9781319042578Author:David S. Moore, William I. Notz, Michael A. FlignerPublisher:W. H. Freeman
 Introduction to the Practice of StatisticsStatisticsISBN:9781319013387Author:David S. Moore, George P. McCabe, Bruce A. CraigPublisher:W. H. Freeman
MATLAB: An Introduction with Applications
Statistics
ISBN:9781119256830
Author:Amos Gilat
Publisher:John Wiley & Sons Inc
Probability and Statistics for Engineering and th...
Statistics
ISBN:9781305251809
Author:Jay L. Devore
Publisher:Cengage Learning
Statistics for The Behavioral Sciences (MindTap C...
Statistics
ISBN:9781305504912
Author:Frederick J Gravetter, Larry B. Wallnau
Publisher:Cengage Learning
Elementary Statistics: Picturing the World (7th E...
Statistics
ISBN:9780134683416
Author:Ron Larson, Betsy Farber
Publisher:PEARSON
The Basic Practice of Statistics
Statistics
ISBN:9781319042578
Author:David S. Moore, William I. Notz, Michael A. Fligner
Publisher:W. H. Freeman
Introduction to the Practice of Statistics
Statistics
ISBN:9781319013387
Author:David S. Moore, George P. McCabe, Bruce A. Craig
Publisher:W. H. Freeman