MATLAB: An Introduction with Applications
6th Edition
ISBN: 9781119256830
Author: Amos Gilat
Publisher: John Wiley & Sons Inc
expand_more
expand_more
format_list_bulleted
Concept explainers
Question
Can you help with 4.7.5 please classes are cancelled due to virus, there is no way I can ask teacher or students at school for help we are not allowed on campus

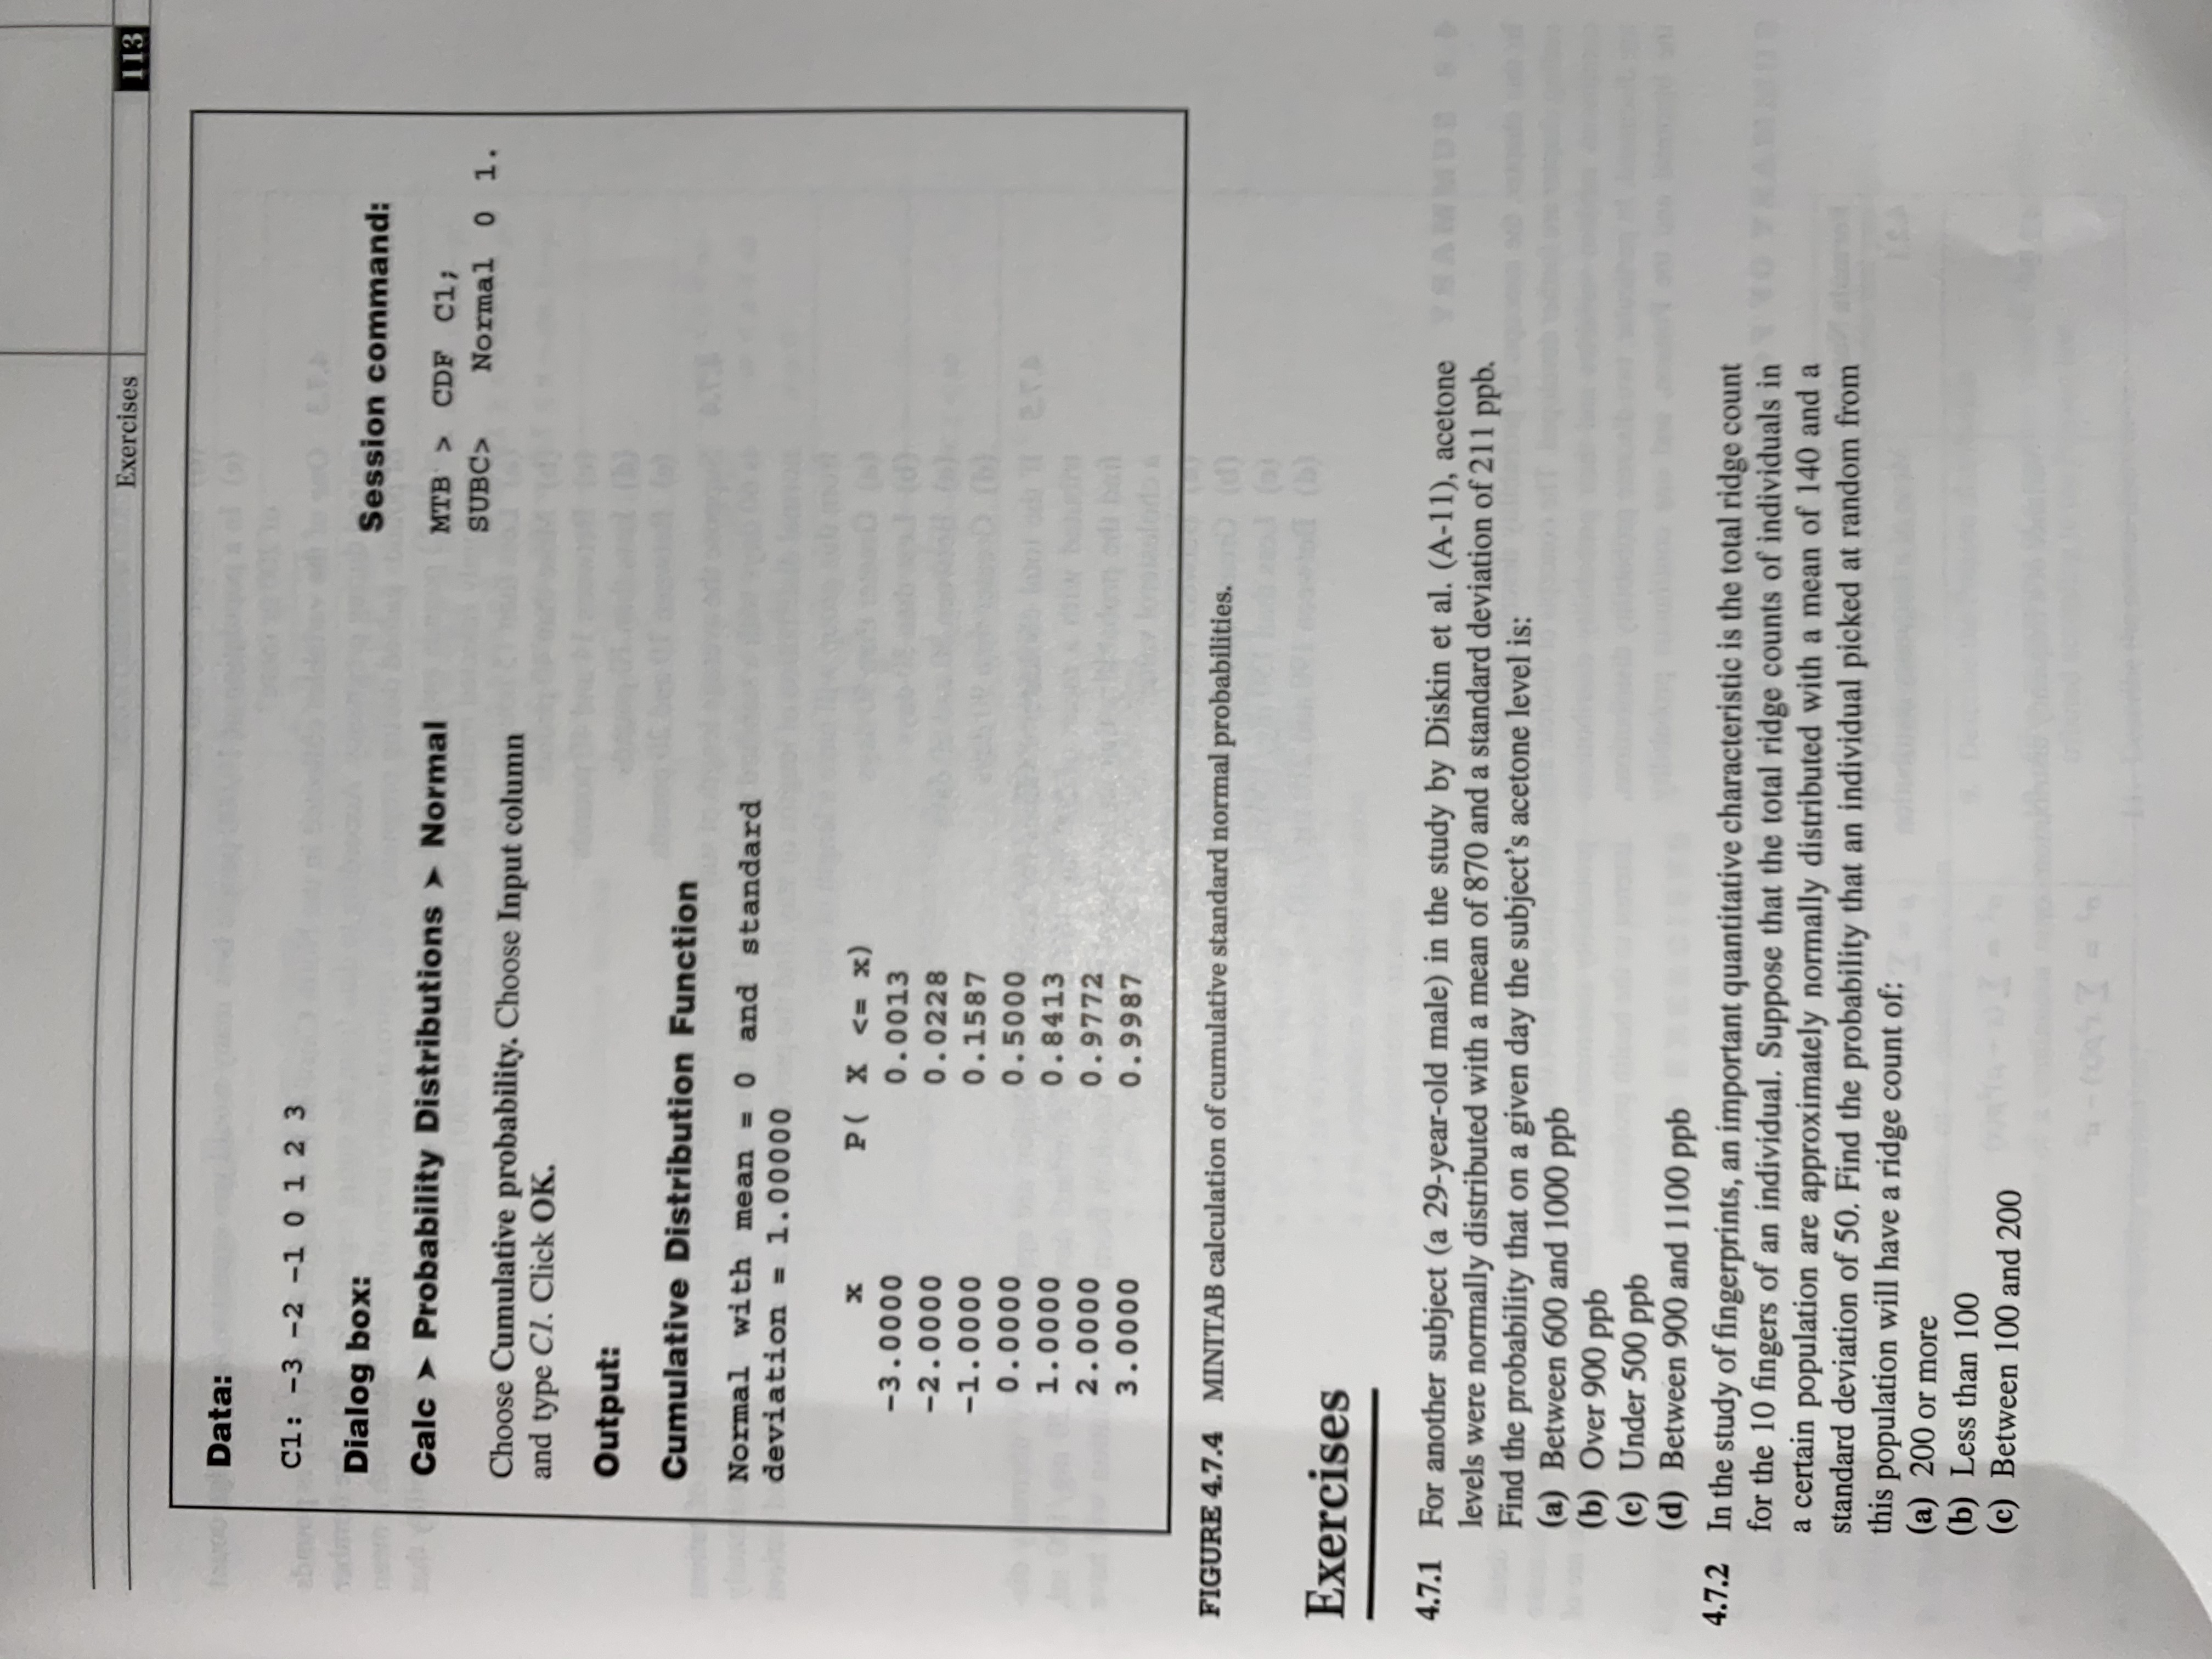
Transcribed Image Text:Exercises
113
Data:
C1: -3 -2 -1 0 1 2 3
abmve
E.F.
Dialog box:
Session command:
Calc > Probability Distributions > Normal
MTB CDF C1;
SUBC>
Normal 0 1.
Choose Cumulative probability. Choose Input column
and type Cl. Click OK.
Output:
Cumulative Distribution Function
Normal with mean =0 and standard
deviation = 1.00000
%3D
х
P( X <= x)
-3.0000
0.0013
-2.0000
0.0228
-1.0000
0.1587
0.0000
0.5000
1.0000
0.8413
2.0000
0.9772
3.0000
0.9987
FIGURE 4.7.4 MINITAB calculation of cumulative standard normal probabilities.
(b)
Exercises
4.7.1 For another subject (a 29-year-old male) in the study by Diskin et al. (A-11), acetone SAL
levels were normally distributed with a mean of 870 and a standard deviation of 211 ppb.
Find the probability that on a given day the subject's acetone level is:
(a) Between 600 and 1000 ppb
(b) Over 900 ppb
(c) Under 500 ppb
(d) Between 900 and 1100 ppb
4.7.2 In the study of fingerprints, an important quantitative characteristic is the total ridge count
for the 10 fingers of an individual, Suppose that the total ridge counts of individuals in
a certain population are approximately normally distributed with a mean of 140 and a
standard deviation of 50, Find the probability that an individual picked at random from
this population will have a ridge count of:
(a) 200 or more
(b) Less than 100
(c) Between 100 and 200

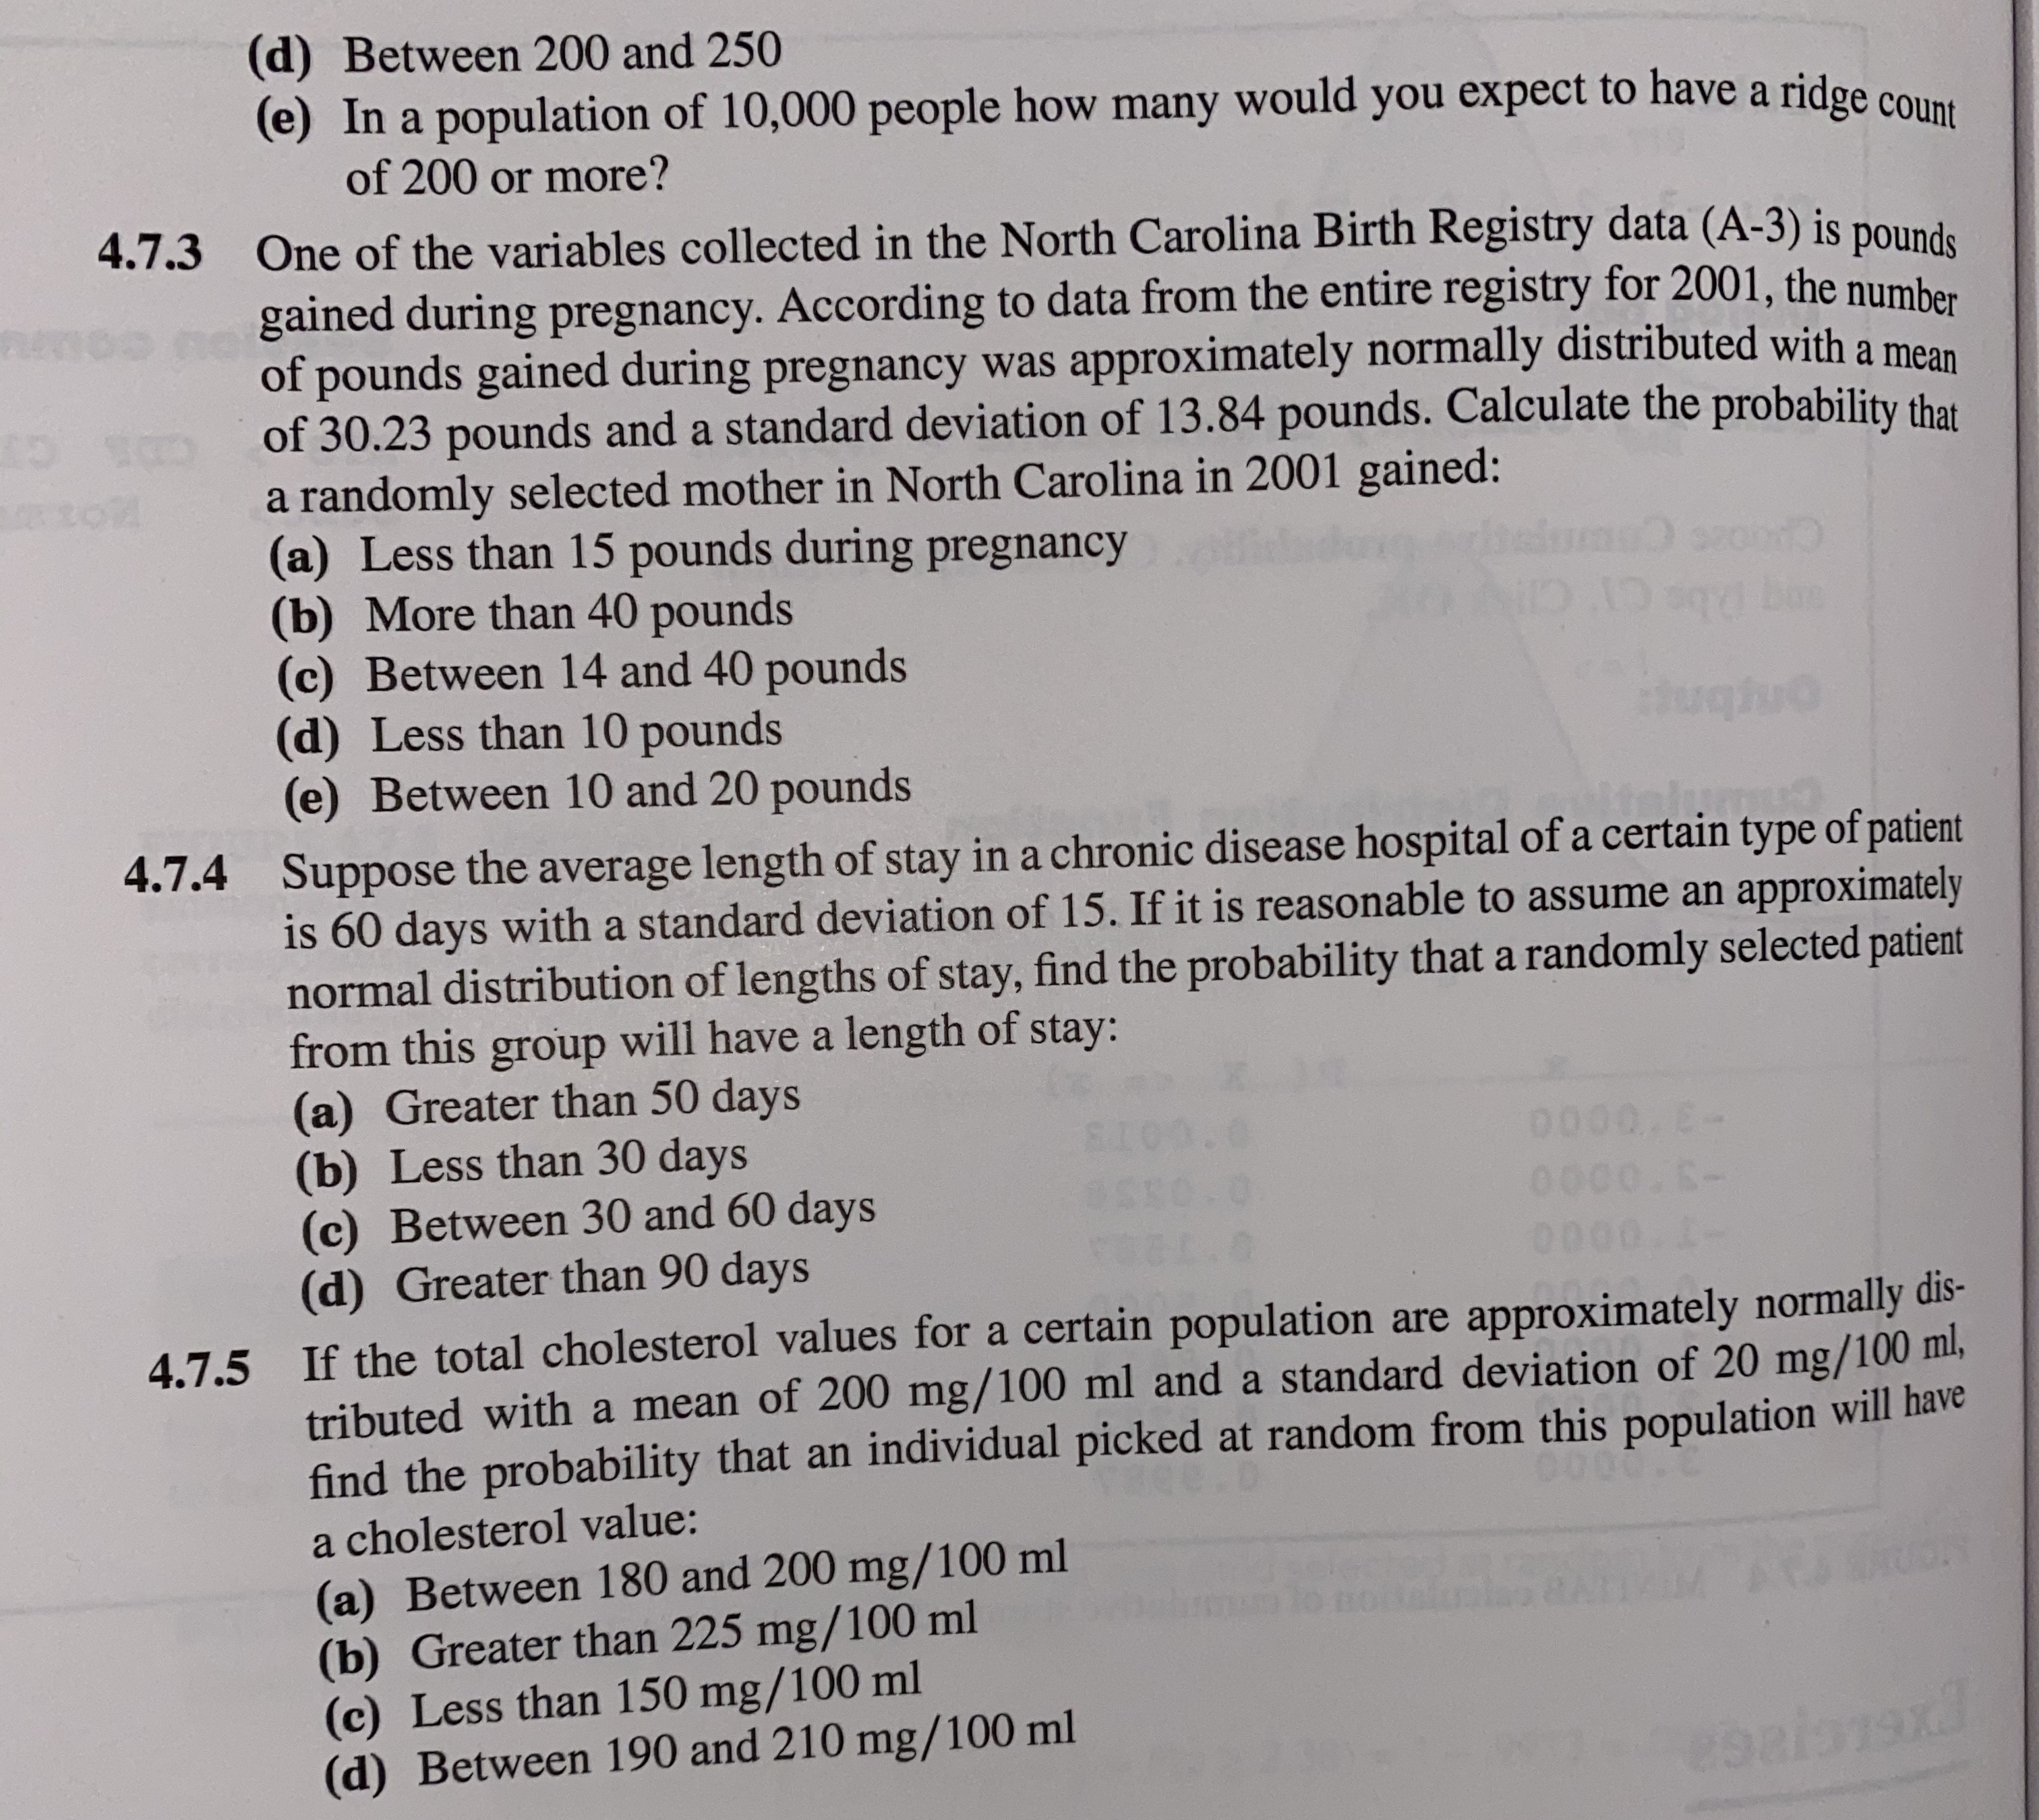
Transcribed Image Text:(d) Between 200 and 250
(e) In a population of 10,000 people how many would you expect to have a ridge connt
of 200 or more?
4.7.3 One of the variables collected in the North Carolina Birth Registry data (A-3) is pounde
gained during pregnancy. According to data from the entire registry for 2001, the number
of pounds gained during pregnancy was approximately normally distributed with a mean
of 30.23 pounds and a standard deviation of 13.84 pounds. Calculate the probability that
a randomly selected mother in North Carolina in 2001 gained:
(a) Less than 15 pounds during pregnancy
(b) More than 40 pounds
(c) Between 14 and 40 pounds
(d) Less than 10 pounds
(e) Between 10 and 20 pounds
ughuo
ielum
4.7.4 Suppose the average length of stay in a chronic disease hospital of a certain type of patient
is 60 days with a standard deviation of 15. If it is reasonable to assume an approximately
normal distribution of lengths of stay, find the probability that a randomly selected patient
from this group will have a length of stay:
(a) Greater than 50 days
(b) Less than 30 days
(c) Between 30 and 60 days
(d) Greater than 90 days
0000. E-
0000.S-
0000 1-
4.7.5 If the total cholesterol values for a certain population are approximately normally dis-
tributed with a mean of 200 mg/100 ml and a standard deviation of 20 mg/100 ml,
find the probability that an individual picked at random from this population will have
a cholesterol value:
(a) Between 180 and 200 mg/100 ml
(b) Greater than 225 mg/100 ml
(c) Less than 150 mg/100 ml
(d) Between 190 and 210 mg/100 ml
Expert Solution
This question has been solved!
Explore an expertly crafted, step-by-step solution for a thorough understanding of key concepts.
This is a popular solution
Trending nowThis is a popular solution!
Step by stepSolved in 4 steps with 4 images

Knowledge Booster
Learn more about
Need a deep-dive on the concept behind this application? Look no further. Learn more about this topic, statistics and related others by exploring similar questions and additional content below.Similar questions
- Show how to do part 3 please!arrow_forwardI need help with 19,20,21,22,23,24 Thank you so mucharrow_forwardThere are 10 women and 3 men signed up to join a salsa dance class. In how many ways can the Instructor choose 6 of the people to join if fewer than 2 must be men? 0 Explanation Check X $ hp ©2022 McGraw Hill LLC. All Rights Reserved Terms of Use Privacy Centerarrow_forward
- Suppose that 33% of McMaster undergraduate students are in their first year. President David Farrar likes to walk around and ask random students how they like the university. On average, how many students (could be a decimal number) will Dr. Farrar need to talk to before he finds a first year student? answer correct to 2 decimalsarrow_forwardて 4.arrow_forwardEvaluatearrow_forward
- suppose we have the following numbers 5,8,12,3 and 4 we want to add one more so that the mean of all the values will be 9. what number should be addedarrow_forwardSeveral years ago, the Arcadia school system was criticized because the average Arcadia High School graduate could read at only the ninth-grade level. After this report was made, a special reading program was established to upgrade skills. The AHS principal wants to know if the reading program worked. If it has, he will request that an accreditation team visit the school. If the program has not improved the reading level to at least 10.0 (sophomore level), the administrator would like to avoid the embarrassment of a poor review. To determine the average reading level of the senior class, we select ten seniors at random. We assume that reading scores are normally distributed. The reading scores for the ten seniors are shown in Table 1. Table 1: Reading Scores for Sample High School Seniors Student Reading Score 1 13.4 2 12.1 3 11.4 4 10.6 5 10.3 6 10.2 7 9.8 8 9.7 9 9.4 10 8.6 Calculate the sample mean…arrow_forwardIs this fully simplifed ?arrow_forward
arrow_back_ios
arrow_forward_ios
Recommended textbooks for you
 MATLAB: An Introduction with ApplicationsStatisticsISBN:9781119256830Author:Amos GilatPublisher:John Wiley & Sons Inc
 Probability and Statistics for Engineering and th...StatisticsISBN:9781305251809Author:Jay L. DevorePublisher:Cengage Learning
 Statistics for The Behavioral Sciences (MindTap C...StatisticsISBN:9781305504912Author:Frederick J Gravetter, Larry B. WallnauPublisher:Cengage Learning
 Elementary Statistics: Picturing the World (7th E...StatisticsISBN:9780134683416Author:Ron Larson, Betsy FarberPublisher:PEARSON
 The Basic Practice of StatisticsStatisticsISBN:9781319042578Author:David S. Moore, William I. Notz, Michael A. FlignerPublisher:W. H. Freeman
 Introduction to the Practice of StatisticsStatisticsISBN:9781319013387Author:David S. Moore, George P. McCabe, Bruce A. CraigPublisher:W. H. Freeman

MATLAB: An Introduction with Applications
Statistics
ISBN:9781119256830
Author:Amos Gilat
Publisher:John Wiley & Sons Inc

Probability and Statistics for Engineering and th...
Statistics
ISBN:9781305251809
Author:Jay L. Devore
Publisher:Cengage Learning

Statistics for The Behavioral Sciences (MindTap C...
Statistics
ISBN:9781305504912
Author:Frederick J Gravetter, Larry B. Wallnau
Publisher:Cengage Learning

Elementary Statistics: Picturing the World (7th E...
Statistics
ISBN:9780134683416
Author:Ron Larson, Betsy Farber
Publisher:PEARSON

The Basic Practice of Statistics
Statistics
ISBN:9781319042578
Author:David S. Moore, William I. Notz, Michael A. Fligner
Publisher:W. H. Freeman

Introduction to the Practice of Statistics
Statistics
ISBN:9781319013387
Author:David S. Moore, George P. McCabe, Bruce A. Craig
Publisher:W. H. Freeman