Database System Concepts
7th Edition
ISBN: 9780078022159
Author: Abraham Silberschatz Professor, Henry F. Korth, S. Sudarshan
Publisher: McGraw-Hill Education
expand_more
expand_more
format_list_bulleted
Question
I need help to do the exercises in Excel and give me the solution provided.

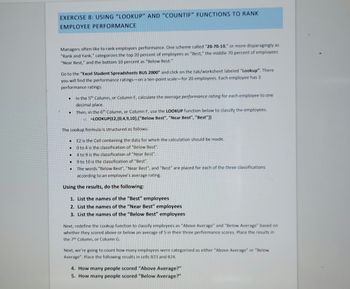
Transcribed Image Text:EXERCISE 8: USING "LOOKUP" AND "COUNTIF" FUNCTIONS TO RANK
EMPLOYEE PERFORMANCE
Managers often like to rank employees performance. One scheme called "20-70-10," or more disparagingly as
"Rank and Yank," categorizes the top 20 percent of employees as "Best," the middle 70 percent of employees
"Near Best," and the bottom 10 percent as "Below Best."
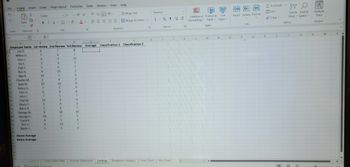
Go to the "Excel Student Spreadsheets BUS 2000" and click on the tab/worksheet labeled "Lookup". There
you will find the performance ratings-on a ten-point scale-for 20 employees. Each employee has 3
performance ratings.
●
.
The Lookup formula is structured as follows:
E2 is the Cell containing the data for which the calculation should be made.
0 to 4 is the classification of "Below Best".
4 to 9 is the classification of "Near Best".
9 to 10 is the classification of "Best".
The words "Below Best", "Near Best", and "Best" are placed for each of the three classifications
according to an employee's average rating.
Using the results, do the following:
1. List the names of the "Best" employees
2. List the names of the "Near Best" employees
3. List the names of the "Below Best" employees
●
In the 5th Column, or Column E, calculate the average performance rating for each employee to one
decimal place.
●
Then, in the 6th Column, or Column F, use the LOOKUP function below to classify the employees.
=LOOKUP(E2,{0,4,9,10},{"Below Best", "Near Best", "Best"})
Next, redefine the Lookup function to classify employees as "Above Average" and "Below Average" based on
whether they scored above or below an average of 5 in their three performance scores. Place the results in
the 7th Column, or Column G.
Next, we're going to count how many employees were categorized as either "Above Average" or "Below
Average". Place the following results in cells B23 and 824.
4. How many people scored "Above Average?"
5. How many people scored "Below Average?"

Transcribed Image Text:File
5.
2
Unde
E2
3
4
5
6
7
8
9
10
11
12
13
14
15
16
17
18
19
Home Insert Draw Page Layout Formulas
X
A A
La
SP
Clipboard F
A
B
C
D
1 Employee Name 1st review 2nd Review 3rd Review
2
Joe D.
6
Mikey D.
7
Joan J.
9
Ida E.
3
Gail S.
Ron A.
Alex R.
Charles M.
Kate M.
Debra H.
John H.
John L.
Paul M.
28
29
30
Paste
Gloria T.
Barry R.
George W.
George H.
Carol K.
Ann H.
Nadia C.
20
21
22
23 Above Average
24 Below Average
25
26
27
Ready
Calibri
BIU-A-
5
9
10
2
10
7
6
7
10
3
5
9
10
4
9
5
Font
7
6
9
4
6
10
7
4
10
5
8
5
9
4
11
6
10
7
5
10
5
8
7
10
5
7
7
5
3
9
9
8
7
9
3
7
10
5
4
7
9
Data
&
Review
View Help
===.
Alignment
Wrap Text
Merge & Center w
G
Average Classification 1 Classification 2
ly
H
General
$%95028
Namber
I
p=r-e Pivot Table Data Income Statement Lookup Breakeven Analysis Line Chart Bar Chart
Accessibility: Good to go
(+)
K
Cell
Conditional Format as
Formatting Table Styles
Styles
L
M
N
O
—
IIX
H
Insert Delete Format
2
P
V
Cells
Q
R
Σ Autosum το
Clear
S
280
Sort & Find &
Filter Select
Editing
T
3
E
U
H
Analyze
Data
Analysis
V
W
X
Expert Solution
This question has been solved!
Explore an expertly crafted, step-by-step solution for a thorough understanding of key concepts.
This is a popular solution
Trending nowThis is a popular solution!
Step by stepSolved in 2 steps with 1 images

Knowledge Booster
Learn more about
Need a deep-dive on the concept behind this application? Look no further. Learn more about this topic, computer-science and related others by exploring similar questions and additional content below.Similar questions
- How would you as the technician go about finding the source of the problems? If you were working at a Help Desk and someone called with these problems, could “you” resolve these problems over the phone? Or would it require a visit from the technician to that computer? Explain.arrow_forwardA Helping Hand is an Australian charity that helps people in Australia and overseas. Their work in Australia involves serving hot meals to the homeless, providing food packs to families in need and companionship to sick children and the elderly. Overseas, the charity employs a nurse to support the Naga Community in the Philippines and runs an Operational Therapy Centre to help children. The charity also runs a yearly mission where volunteers travel to various countries to deliver medical aid and support the vulnerable. The charity has identified the inefficient way in which it currently operates. This inefficiency means the charity is unable to easily maintain compliance with regulatory requirements (e.g. WWC monitoring) nor easily fill available shifts and engage with current and prospective stakeholders. To solve the issue, the charity wants to develop a website that facilitates administration (i.e. Login Creations, Registration Requests and Password Resets), Donations and…arrow_forwardExplain whether you agree or disagree with the statement that a person needs to have a solid math foundation in order to properly use Microsoft Excel. What are the benefits, if any, for having a solid math foundation? Can a person who is not efficient in math become proficient in Excel? Why or why not?arrow_forward
- Take the reader step by step through the procedure you went through to get your credentials and expertise.arrow_forwardThink about the myriad of excuses that someone might potentially come up with to avoid doing the right thing or according to the rules. Both of these responsibilities have become less challenging as a direct result of recent advances in technical capability.arrow_forwardWhat other options are there for me to get help with Excel's functions?arrow_forward
arrow_back_ios
arrow_forward_ios
Recommended textbooks for you
 Database System ConceptsComputer ScienceISBN:9780078022159Author:Abraham Silberschatz Professor, Henry F. Korth, S. SudarshanPublisher:McGraw-Hill Education
 Starting Out with Python (4th Edition)Computer ScienceISBN:9780134444321Author:Tony GaddisPublisher:PEARSON
 Digital Fundamentals (11th Edition)Computer ScienceISBN:9780132737968Author:Thomas L. FloydPublisher:PEARSON
 C How to Program (8th Edition)Computer ScienceISBN:9780133976892Author:Paul J. Deitel, Harvey DeitelPublisher:PEARSON
 Database Systems: Design, Implementation, & Manag...Computer ScienceISBN:9781337627900Author:Carlos Coronel, Steven MorrisPublisher:Cengage Learning
 Programmable Logic ControllersComputer ScienceISBN:9780073373843Author:Frank D. PetruzellaPublisher:McGraw-Hill Education

Database System Concepts
Computer Science
ISBN:9780078022159
Author:Abraham Silberschatz Professor, Henry F. Korth, S. Sudarshan
Publisher:McGraw-Hill Education

Starting Out with Python (4th Edition)
Computer Science
ISBN:9780134444321
Author:Tony Gaddis
Publisher:PEARSON

Digital Fundamentals (11th Edition)
Computer Science
ISBN:9780132737968
Author:Thomas L. Floyd
Publisher:PEARSON

C How to Program (8th Edition)
Computer Science
ISBN:9780133976892
Author:Paul J. Deitel, Harvey Deitel
Publisher:PEARSON

Database Systems: Design, Implementation, & Manag...
Computer Science
ISBN:9781337627900
Author:Carlos Coronel, Steven Morris
Publisher:Cengage Learning

Programmable Logic Controllers
Computer Science
ISBN:9780073373843
Author:Frank D. Petruzella
Publisher:McGraw-Hill Education