A First Course in Probability (10th Edition)
10th Edition
ISBN: 9780134753119
Author: Sheldon Ross
Publisher: PEARSON
expand_more
expand_more
format_list_bulleted
Question

Transcribed Image Text:**Exercise 3.18.** Let \( X \) be a normal random variable with mean 3 and variance 4.
(a) Find the probability \( P(2 < X < 6) \).
(b) Find the value \( c \) such that \( P(X > c) = 0.33 \).

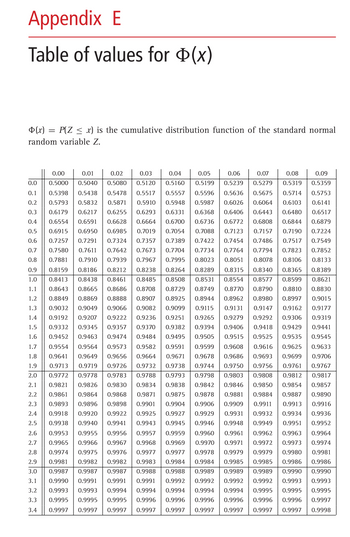
Transcribed Image Text:# Appendix E: Table of Values for Φ(x)
## Overview
The table displayed represents the cumulative distribution function (CDF) of the standard normal random variable \( Z \), defined as \( \Phi(x) = P(Z \leq x) \). This function is essential for statistical analyses involving normal distributions, as it provides the probability that \( Z \) is less than or equal to a given value \( x \).
## Table Structure
The table is organized to display probabilities \( \Phi(x) \) for different values of \( x \). It is arranged with two main components:
- **Row Headers**: These represent the integral part of \( x \), starting from 0.0 through 3.4 in increments of 0.1.
- **Column Headers**: These represent decimal increments, ranging from 0.00 through 0.09.
### Example Interpretation
- To find \( \Phi(0.53) \), locate the row for 0.5 and the column for 0.03. The intersection gives a value of \( 0.7019 \).
## Application
This table is typically used to find the probability of a value falling within a given range of a normal distribution. By referencing the table, one can easily determine cumulative probabilities needed for various statistical applications.
Expert Solution
This question has been solved!
Explore an expertly crafted, step-by-step solution for a thorough understanding of key concepts.
This is a popular solution
Trending nowThis is a popular solution!
Step by stepSolved in 4 steps with 12 images

Knowledge Booster
Similar questions
- 5/1/24, 11:52 PM A L Solve the problem. 17) The accompanying table shows the probability distribution for x, the number that shows up 17) a loaded die is rolled. Find the variance for the probability distribution. x P(x) 1 0.10 2 0.22 3 0.16 4 0.10 5 0.17 6 0.25arrow_forwardX and Y be standard normal random variables with correlation p. Compute the joint and marginal distributions of X+Y and X-Y. Are X+Y and X−Y independent?arrow_forwardLet the random variable X be defined on the support set (1,2) with pdf fX(x) = (4/15)x3, Find the variance of X.arrow_forward
arrow_back_ios
arrow_forward_ios
Recommended textbooks for you
 A First Course in Probability (10th Edition)ProbabilityISBN:9780134753119Author:Sheldon RossPublisher:PEARSON

A First Course in Probability (10th Edition)
Probability
ISBN:9780134753119
Author:Sheldon Ross
Publisher:PEARSON
