Human Anatomy & Physiology (11th Edition)
11th Edition
ISBN: 9780134580999
Author: Elaine N. Marieb, Katja N. Hoehn
Publisher: PEARSON
expand_more
expand_more
format_list_bulleted
Question
Do not use Ai

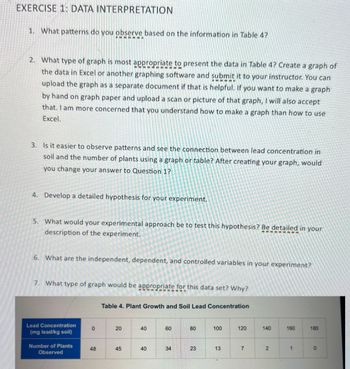
Transcribed Image Text:EXERCISE 1: DATA INTERPRETATION
1. What patterns do you observe based on the information in Table 4?
2. What type of graph is most appropriate to present the data in Table 4? Create a graph of
the data in Excel or another graphing software and submit it to your instructor. You can
upload the graph as a separate document if that is helpful. If you want to make a graph
by hand on graph paper and upload a scan or picture of that graph, I will also accept
that. I am more concerned that you understand how to make a graph than how to use
Excel.
3. Is it easier to observe patterns and see the connection between lead concentration in
soil and the number of plants using a graph or table? After creating your graph, would
you change your answer to Question 1?
4. Develop a detailed hypothesis for your experiment.
5. What would your experimental approach be to test this hypothesis? Be detailed in your
description of the experiment.
6. What are the independent, dependent, and controlled variables in your experiment?
7. What type of graph would be appropriate for this data set? Why?
Table 4. Plant Growth and Soil Lead Concentration
Lead Concentration
(mg lead/kg soil)
0
20
20
Number of Plants
Observed
48
45
40
40
40
40
60
60
80
100
120
140
160
180
34
34
23
13
7
2
1
0
Expert Solution
This question has been solved!
Explore an expertly crafted, step-by-step solution for a thorough understanding of key concepts.
Step by stepSolved in 2 steps with 2 images

Knowledge Booster
Similar questions
- K7arrow_forwardDescribe the crossed extensor reflex that would accompany a flexion reflex. stimulus _________________________________________ receptor _________________________________________ afferent pathway __________________________________ integrating center __________________________________ efferent path 1 ____________________________________ effector 1 _________________________________________ response 1 _________________________________________ efferent path 2 ____________________________________ effector 2 _________________________________________ response 2 _________________________________________arrow_forwardLabel these parts of the knee jerk reactionarrow_forward
arrow_back_ios
arrow_forward_ios
Recommended textbooks for you
 Human Anatomy & Physiology (11th Edition)BiologyISBN:9780134580999Author:Elaine N. Marieb, Katja N. HoehnPublisher:PEARSON
 Biology 2eBiologyISBN:9781947172517Author:Matthew Douglas, Jung Choi, Mary Ann ClarkPublisher:OpenStax
 Anatomy & PhysiologyBiologyISBN:9781259398629Author:McKinley, Michael P., O'loughlin, Valerie Dean, Bidle, Theresa StouterPublisher:Mcgraw Hill Education,
 Molecular Biology of the Cell (Sixth Edition)BiologyISBN:9780815344322Author:Bruce Alberts, Alexander D. Johnson, Julian Lewis, David Morgan, Martin Raff, Keith Roberts, Peter WalterPublisher:W. W. Norton & Company
 Laboratory Manual For Human Anatomy & PhysiologyBiologyISBN:9781260159363Author:Martin, Terry R., Prentice-craver, CynthiaPublisher:McGraw-Hill Publishing Co.
 Inquiry Into Life (16th Edition)BiologyISBN:9781260231700Author:Sylvia S. Mader, Michael WindelspechtPublisher:McGraw Hill Education

Human Anatomy & Physiology (11th Edition)
Biology
ISBN:9780134580999
Author:Elaine N. Marieb, Katja N. Hoehn
Publisher:PEARSON

Biology 2e
Biology
ISBN:9781947172517
Author:Matthew Douglas, Jung Choi, Mary Ann Clark
Publisher:OpenStax

Anatomy & Physiology
Biology
ISBN:9781259398629
Author:McKinley, Michael P., O'loughlin, Valerie Dean, Bidle, Theresa Stouter
Publisher:Mcgraw Hill Education,

Molecular Biology of the Cell (Sixth Edition)
Biology
ISBN:9780815344322
Author:Bruce Alberts, Alexander D. Johnson, Julian Lewis, David Morgan, Martin Raff, Keith Roberts, Peter Walter
Publisher:W. W. Norton & Company

Laboratory Manual For Human Anatomy & Physiology
Biology
ISBN:9781260159363
Author:Martin, Terry R., Prentice-craver, Cynthia
Publisher:McGraw-Hill Publishing Co.

Inquiry Into Life (16th Edition)
Biology
ISBN:9781260231700
Author:Sylvia S. Mader, Michael Windelspecht
Publisher:McGraw Hill Education