
MATLAB: An Introduction with Applications
6th Edition
ISBN: 9781119256830
Author: Amos Gilat
Publisher: John Wiley & Sons Inc
expand_more
expand_more
format_list_bulleted
Related questions
Topic Video
Question
Pls help
might need to use excel
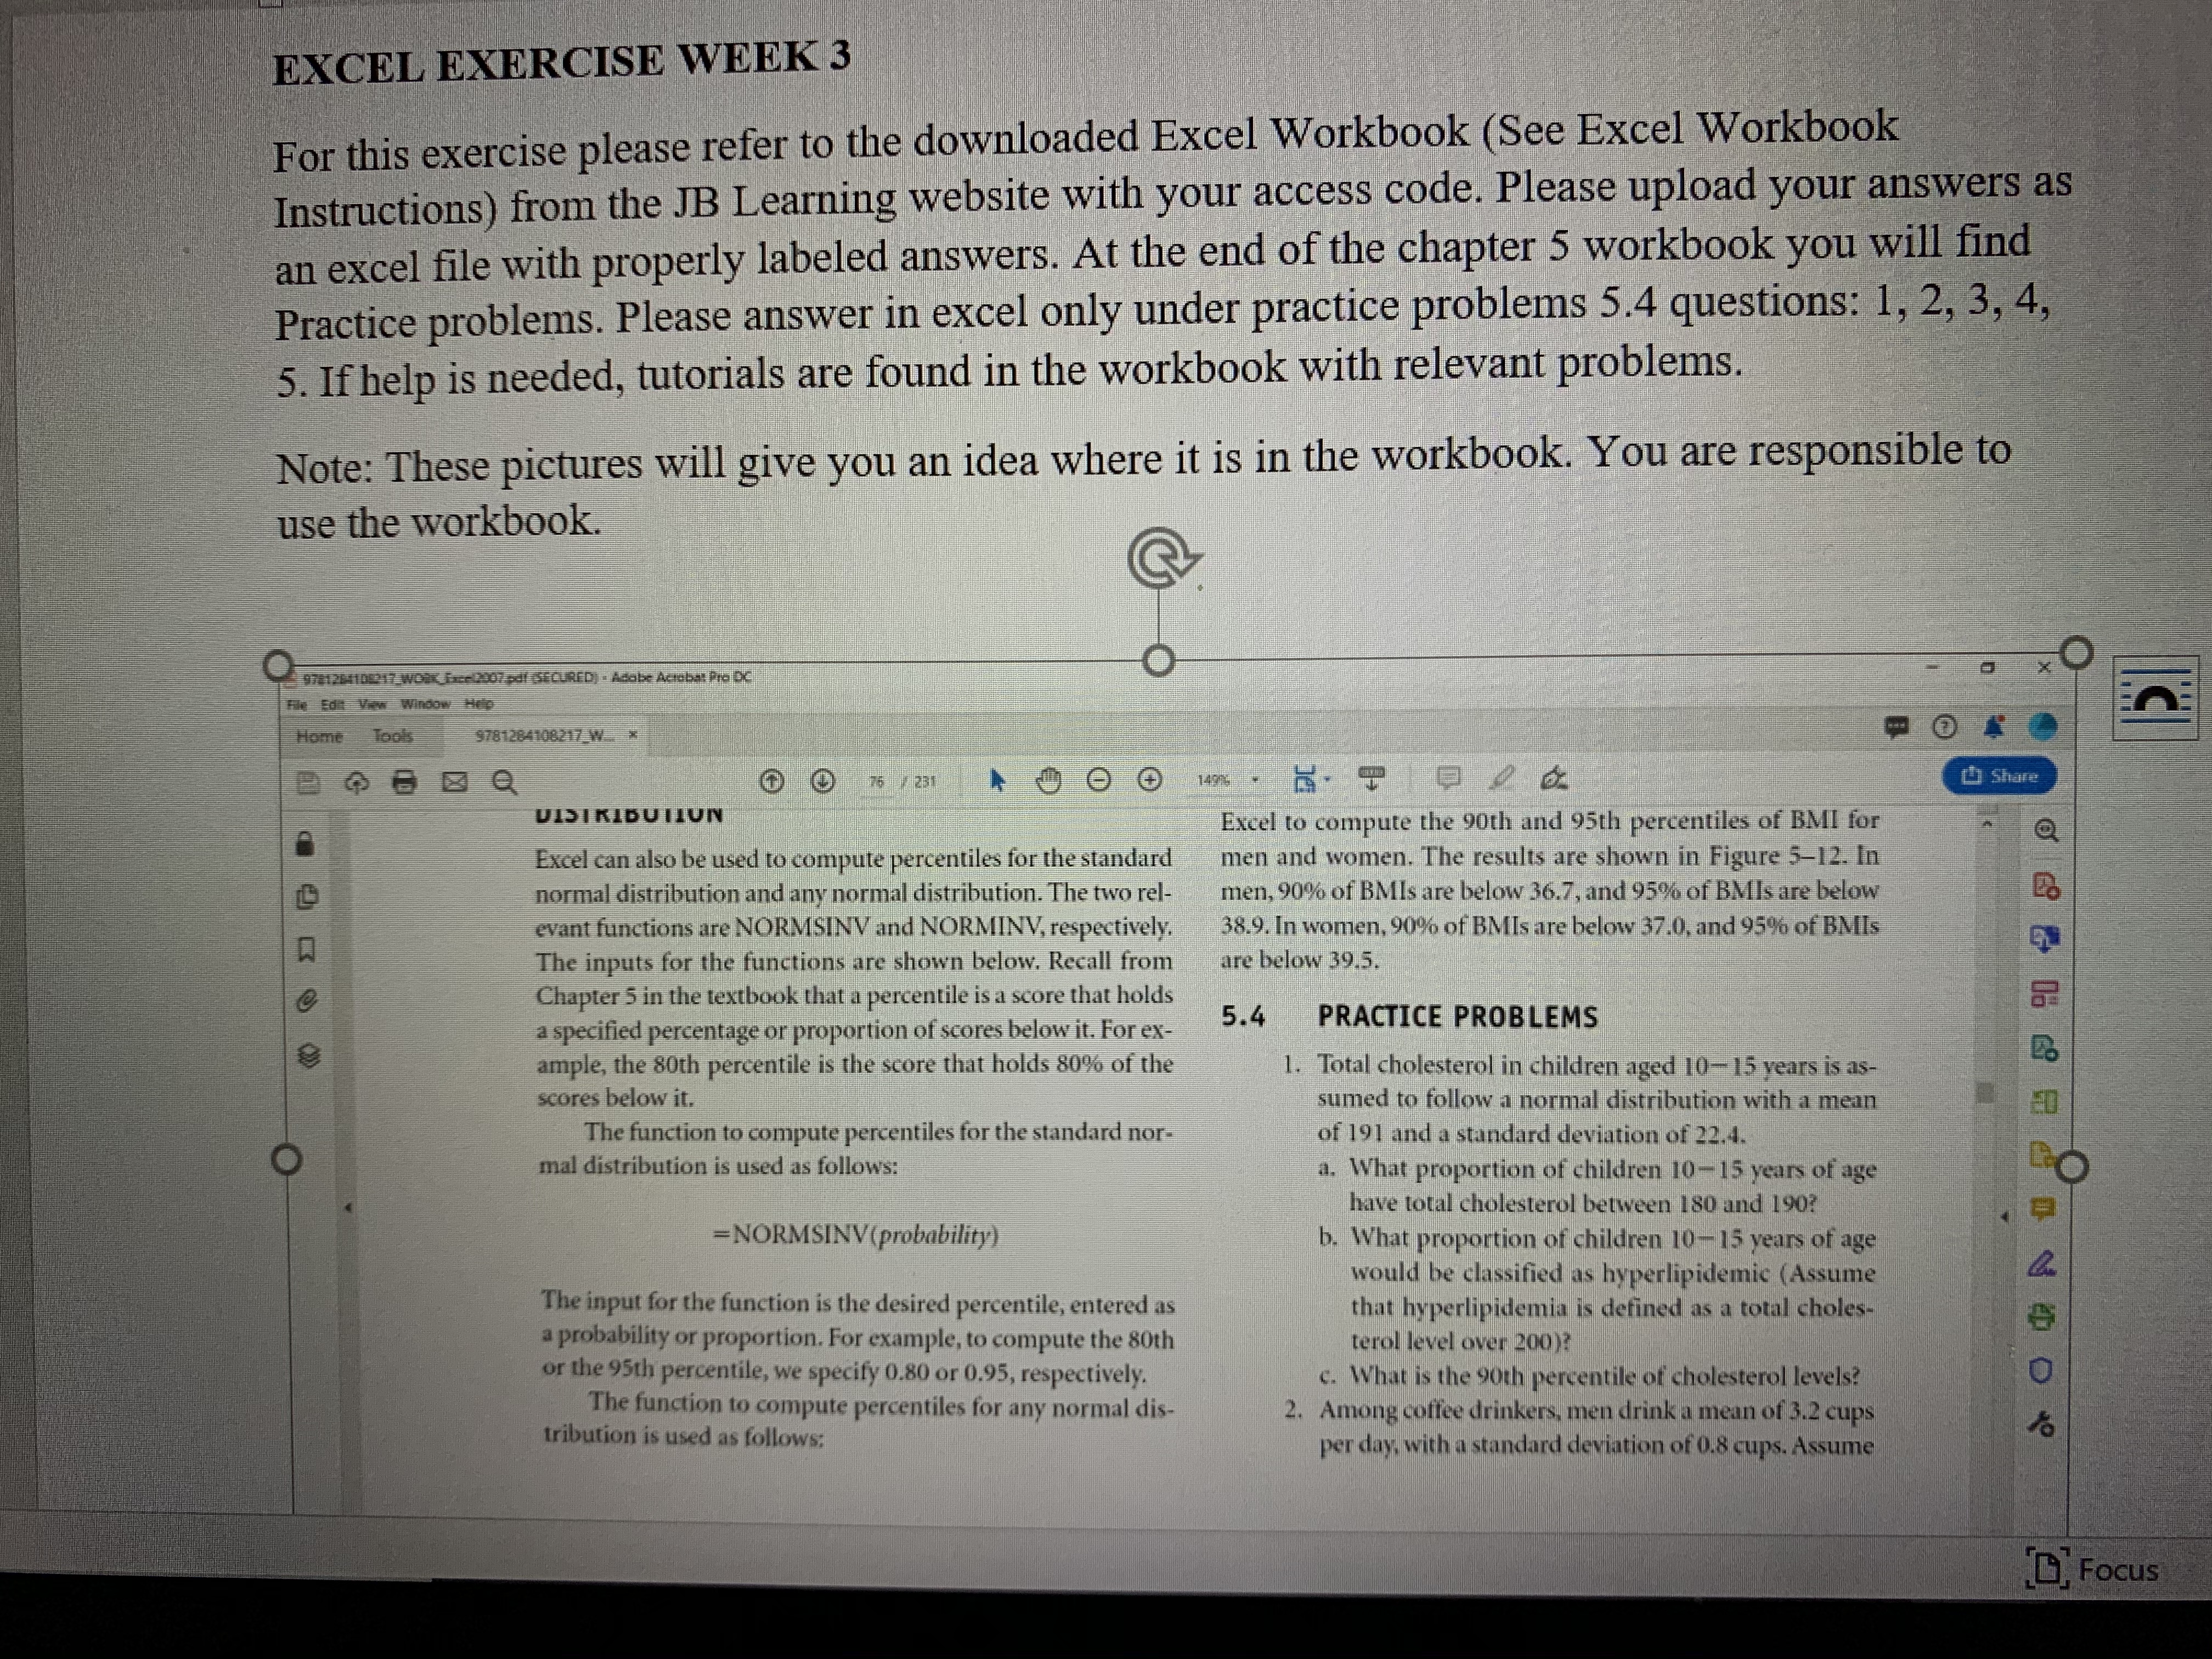

Transcribed Image Text:EXCEL EXERCISE WEEK 3
For this exercise please refer to the downloaded Excel Workbook (See Excel Workbook
Instructions) from the JB Learning website with your access code. Please upload your answers as
an excel file with properly labeled answers. At the end of the chapter 5 workbook you will find
Practice problems. Please answer in excel only under practice problems 5.4 questions: 1, 2, 3, 4,
5. If help is needed, tutorials are found in the workbook with relevant problems.
Note: These pictures will give you an idea where it is in the workbook. You are responsible to
use the workbook.
978126410217 WOK Exce200/pdf.5ECURED)-Adabe Acreba Pro DC
He Edit VaM Window Help.
Home
Tools
9781284108217/W *
149
Share
Excel to compute the 90th and 95th percentiles of BMI for
men and women. The results are shown in Figure 5-12. In
men, 90% of BMIS are below 36.7, and 95% of BMIS are below
38.9. In women, 90% of BMIS are below 37.0, and 95% of BMIS
UISTRIBUTION
Excel can also be used to compute percentiles for the standard
normal distribution and any normal distribution. The two rel-
evant functions are NORMSINV and NORMINV, respectively.
The inputs for the functions are shown below. Recall from
Chapter 5 in the textbook that a percentile is a score that holds
a specified percentage or proportion of scores below it. For ex-
ample, the 80th percentile is the score that holds 80% of the
scores below it.
are below 39.5,
5.4
PRACTICE PROBLEMS
1. Total cholesterol in children aged 10-15 years is as-
sumed to follow a normal distribution with a mean
of 191 and a standard deviation of 22.4.
a. What proportion of children 10-15 years of age
have total cholesterol between 180 and 190?
b. What proportion of children 10-15 years of age
would be classified as hyperlipidemic (Assume
that hyperlipidemia is defined as a total choles-
terol level over 200)?
ED
The function to compute percentiles for the standard nor-
mal distribution is used as follows:
=NORMSINV(probability)
The input for the function is the desired percentile, entered as
a probability or proportion. For example, to compute the 80th
or the 95th percentile, we specify 0.80 or 0.95, respectively.
The function to compute percentiles for any normal dis-
tribution is used as follows:
c. What is the 9oth percentile of cholesterol levels?
2. Among coffee drinkers, men drink a mean of 3.2 cups
per day, with a standard deviation of 0.8 cups. Assume
OFocus
Expert Solution
This question has been solved!
Explore an expertly crafted, step-by-step solution for a thorough understanding of key concepts.

This is a popular solution

Trending nowThis is a popular solution!

Step by stepSolved in 2 steps with 3 images

Knowledge Booster


Learn more about
Need a deep-dive on the concept behind this application? Look no further. Learn more about this topic, statistics and related others by exploring similar questions and additional content below.Similar questions
- Evaluate I = | 5+ 3r3 drarrow_forwardPerform the operationarrow_forwardI have attached the question in the image upload below. Please refer to the attachments for the question details. Please read the questions carefully and provide correct answers as well as the solutions. I appreciate your help, thank you.arrow_forward
- Can you write a code for this task, i need to do it in R commander?arrow_forwardQUESTION 2 Jim wants to buy a computer. The total cost is $1,180. If he can save $60 a month, how long will it take for him to save up for the computer? For the toolbar, press ALT+F10 (PC) or ALT+FN+F10 (Mac). BIUS Paragraph Arial 14px !!arrow_forward
arrow_back_ios
arrow_forward_ios
Recommended textbooks for you
- MATLAB: An Introduction with ApplicationsStatisticsISBN:9781119256830Author:Amos GilatPublisher:John Wiley & Sons Inc
 Probability and Statistics for Engineering and th...StatisticsISBN:9781305251809Author:Jay L. DevorePublisher:Cengage Learning
 Statistics for The Behavioral Sciences (MindTap C...StatisticsISBN:9781305504912Author:Frederick J Gravetter, Larry B. WallnauPublisher:Cengage Learning
  Elementary Statistics: Picturing the World (7th E...StatisticsISBN:9780134683416Author:Ron Larson, Betsy FarberPublisher:PEARSON
 The Basic Practice of StatisticsStatisticsISBN:9781319042578Author:David S. Moore, William I. Notz, Michael A. FlignerPublisher:W. H. Freeman
 Introduction to the Practice of StatisticsStatisticsISBN:9781319013387Author:David S. Moore, George P. McCabe, Bruce A. CraigPublisher:W. H. Freeman
MATLAB: An Introduction with Applications
Statistics
ISBN:9781119256830
Author:Amos Gilat
Publisher:John Wiley & Sons Inc
Probability and Statistics for Engineering and th...
Statistics
ISBN:9781305251809
Author:Jay L. Devore
Publisher:Cengage Learning
Statistics for The Behavioral Sciences (MindTap C...
Statistics
ISBN:9781305504912
Author:Frederick J Gravetter, Larry B. Wallnau
Publisher:Cengage Learning
Elementary Statistics: Picturing the World (7th E...
Statistics
ISBN:9780134683416
Author:Ron Larson, Betsy Farber
Publisher:PEARSON
The Basic Practice of Statistics
Statistics
ISBN:9781319042578
Author:David S. Moore, William I. Notz, Michael A. Fligner
Publisher:W. H. Freeman
Introduction to the Practice of Statistics
Statistics
ISBN:9781319013387
Author:David S. Moore, George P. McCabe, Bruce A. Craig
Publisher:W. H. Freeman