
MATLAB: An Introduction with Applications
6th Edition
ISBN: 9781119256830
Author: Amos Gilat
Publisher: John Wiley & Sons Inc
expand_more
expand_more
format_list_bulleted
Related questions
Question
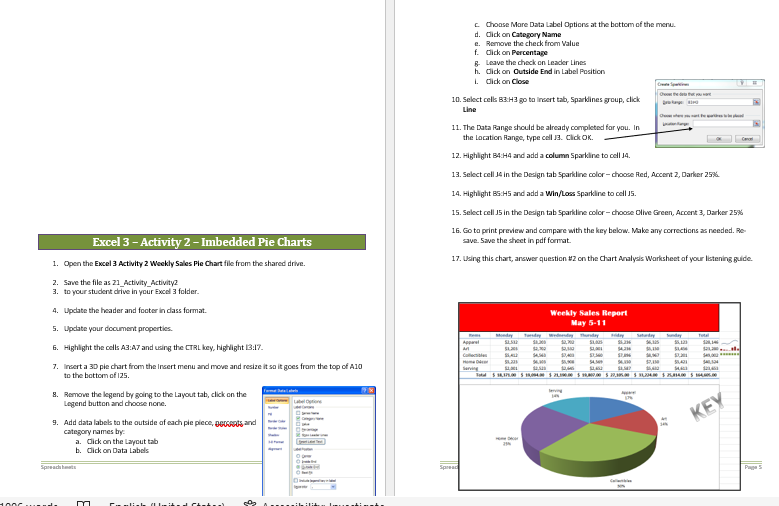

Transcribed Image Text:Excel 3 - Activity 2 - Imbedded Pie Charts
1. Open the Excel 3 Activity 2 Weekly Sales Pie Chart file from the shared drive.
2. Save the file as 21 Activity Activity2
3. to your student drive in your Excel 3 folder.
4. Update the header and footer in class format.
5. Update your document properties.
6. Highlight the cells A3:A7 and using the CTRL key, highlight 13:17.
7. Insert a 3D ple chart from the Insert menu and move and resize it so it goes from the top of A10
to the bottom of 125.
8. Remove the legend by going to the Layout tab, click on the
Legend button and choose none.
9. Add data labels to the outside of each pie plece, Band
category names by
a. Click on the Layout tab
b. Click on Data Labels
m
Cumlish (United Chakr
50₂
Spread
c. Choose More Data Label Options at the bottom of the menu.
d. Click on Category Name
e. Remove the check from Value
f. Click on Percentage
g. Leave the check on Leader Lines
h. Click on Outside End in Label Position
1. Click on Close
THAI HO
10. Select cells 83:H3 go to Insert tab, Sparklines group, click
Line
11. The Data Range should be already completed for you. In
the Location Range, type cell J3. Click OK.
12. Highlight B4:H4 and add a column Sparkline to cell 14.
13. Select cell 34 in the Design tab Sparkline color-choose Red, Accent 2, Darker 25%
14. Highlight B5:H5 and add a Win/Loss Sparkline to cell 15.
15. Select cell J5 in the Design tab Sparkline color-choose Olive Green, Accent 3, Darker 25%
16. Go to print preview and compare with the key below. Make any corrections as needed. Re-
save. Save the sheet in pdf format.
17. Using this chart, answer question #2 on the Chart Analysis Worksheet of your listening guide.
Weekly Sales Report
May 5-11
Torsday Wednesday Thursday Hiday Saturday
Total
SLS
56,123
A
$4.316
Collect
$1,231
500
94.00
S
SLI $2,50
$4
Total $14,175.00 $15,094.00 $ 21,100.00 $ 11,00.00 $ 27,305.00 $ 31,204.00 $25,814.00 $164.005.00
54.3
54.100 17.11
Serving
lerving
KEY
Spread
js
Page 5

Transcribed Image Text:Weekly Sales Report
May 5-11
Wednesday Thursday
Friday
Items
Apparel
$2,532
$3,203
$2,702
$3,025
$5,236
$6,325
$5,123
$28,146
Art
$3,203
$2,702
$2,532
$2,001
$4,236
$5,150
$3,456
$23,280
Collectibles
$5,412
$4,563
$7,403
$7,560
$7,896
$8,967
$7,201
$49,002
Home Décor
$5,223
$6,103
$5,908
$4,569
$6,150
$7,150
$5,421
$40,524
Serving
$2,001
$2,523
$2,645
$2,652
$3,587
$5,632
$4,613
$23,653
Total $ 18,371.00 $ 19,094.00 $ 21,190.00 $ 19,807.00 $ 27,105.00 $ 33,224.00 $ 25,814.00 $ 164,605.00
Monday
Tuesday
Saturday
Sunday
Total
Expert Solution
This question has been solved!
Explore an expertly crafted, step-by-step solution for a thorough understanding of key concepts.

Step by stepSolved in 2 steps

Knowledge Booster

Similar questions
arrow_back_ios
SEE MORE QUESTIONS
arrow_forward_ios
Recommended textbooks for you
- MATLAB: An Introduction with ApplicationsStatisticsISBN:9781119256830Author:Amos GilatPublisher:John Wiley & Sons Inc
 Probability and Statistics for Engineering and th...StatisticsISBN:9781305251809Author:Jay L. DevorePublisher:Cengage Learning
 Statistics for The Behavioral Sciences (MindTap C...StatisticsISBN:9781305504912Author:Frederick J Gravetter, Larry B. WallnauPublisher:Cengage Learning
  Elementary Statistics: Picturing the World (7th E...StatisticsISBN:9780134683416Author:Ron Larson, Betsy FarberPublisher:PEARSON
 The Basic Practice of StatisticsStatisticsISBN:9781319042578Author:David S. Moore, William I. Notz, Michael A. FlignerPublisher:W. H. Freeman
 Introduction to the Practice of StatisticsStatisticsISBN:9781319013387Author:David S. Moore, George P. McCabe, Bruce A. CraigPublisher:W. H. Freeman
MATLAB: An Introduction with Applications
Statistics
ISBN:9781119256830
Author:Amos Gilat
Publisher:John Wiley & Sons Inc
Probability and Statistics for Engineering and th...
Statistics
ISBN:9781305251809
Author:Jay L. Devore
Publisher:Cengage Learning
Statistics for The Behavioral Sciences (MindTap C...
Statistics
ISBN:9781305504912
Author:Frederick J Gravetter, Larry B. Wallnau
Publisher:Cengage Learning
Elementary Statistics: Picturing the World (7th E...
Statistics
ISBN:9780134683416
Author:Ron Larson, Betsy Farber
Publisher:PEARSON
The Basic Practice of Statistics
Statistics
ISBN:9781319042578
Author:David S. Moore, William I. Notz, Michael A. Fligner
Publisher:W. H. Freeman
Introduction to the Practice of Statistics
Statistics
ISBN:9781319013387
Author:David S. Moore, George P. McCabe, Bruce A. Craig
Publisher:W. H. Freeman