
MATLAB: An Introduction with Applications
6th Edition
ISBN: 9781119256830
Author: Amos Gilat
Publisher: John Wiley & Sons Inc
expand_more
expand_more
format_list_bulleted
Related questions
Question
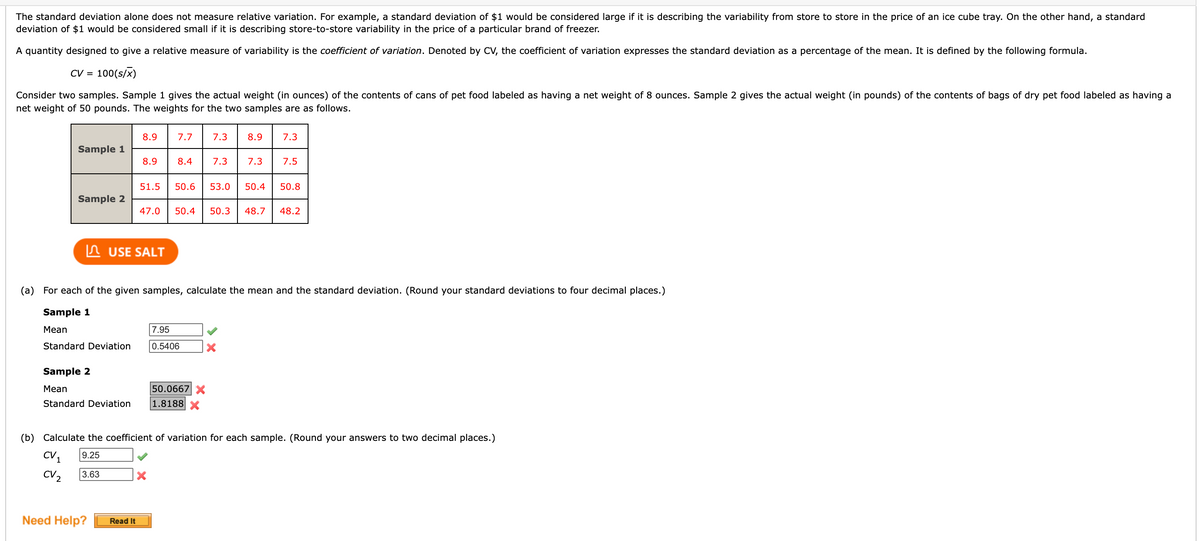

Transcribed Image Text:The standard deviation alone does not measure relative variation. For example, a standard deviation of $1 would be considered large if it is describing the variability from store to store in the price of an ice cube tray. On the other hand, a standard
deviation of $1 would be considered small if it is describing store-to-store variability in the price of a particular brand of freezer.
A quantity designed to give a relative measure of variability is the coefficient of variation. Denoted by CV, the coefficient of variation expresses the standard deviation as a percentage of the mean. It is defined by the following formula.
CV = 100(s/x)
Consider two samples. Sample 1 gives the actual weight (in ounces) of the contents of cans of pet food labeled as having a net weight of 8 ounces. Sample 2 gives the actual weight (in pounds) of the contents of bags of dry pet food labeled as having a
net weight of 50 pounds. The weights for the two samples are as follows.
8.9
7.7
7.3
8.9
7.3
Sample 1
8.9
8.4
7.3
7.3
7.5
51.5
50.6
53.0
50.4
50.8
Sample 2
47.0
50.4
50.3
48.7
48.2
In USE SALT
(a) For each of the given samples, calculate the mean and the standard deviation. (Round your standard deviations to four decimal places.)
Sample 1
Mean
7.95
Standard Deviation
0.5406
Sample 2
Mean
50.0667X
Standard Deviation
|1.8188
(b) Calculate the coefficient of variation for each sample. (Round your answers to two decimal places.)
CV
9.25
CV2
3.63
Need Help?
Read It
Expert Solution
This question has been solved!
Explore an expertly crafted, step-by-step solution for a thorough understanding of key concepts.

This is a popular solution

Trending nowThis is a popular solution!

Step by stepSolved in 3 steps with 3 images

Knowledge Booster

Similar questions
- Cost for standard veterinary services at a local animal hospital follows a Normal model with a mean of $80 and a standard deviation of $20. Fill in the blanks according to this model: The middle 95% of veterinary bills cost between $ type your answer.... 2 type your answer... type your answer... Previous 3 S 3 e d 4 % of veterinary bills are between $60 and $80. % of bills are between $20 and $140. r f % 5 t 9 A 6 y h & 7 and $ type your answer... U n ★ 8 i E 9 k ✔ O P ctriarrow_forwardThe distribution of the amount of money spent by students for textbooks in a semester is approximately normal in shape with a mean of $235 and a standard deviation of $20. According to the standard deviation rule, almost 2.5% of the students spent more than what amount of money on textbooks in a semester? A. O $195 B. $215 C. $235 D. $275 E. $295arrow_forwardA set of data had a sample mean of 42.0 and a sample standard deviation of 11.0. What is the coefficient of variation (CV), expressed as a percentage, for this set of data? Round your answer to two decimal places. Do not include the percent sign. Your Answer:arrow_forward
- An employment evaluation exam has a standard deviation of 15. One particular exam with raw scores of 142 and 165 have z scores of -0.5. Find the mean of the distribution. 150 2 1603 1495 135 2arrow_forwardfitting a straight line to a set of data yields the following prediction line. Predict the mean value of Y for x=4arrow_forwardWhich is NOT a correct statement about mean, median, standard deviation, or interquartile range? a. Mean is more affected by changes in extreme observations b. Median is less affected by changes in extreme observations c. Standard deviation is less affected by changes in extreme observations d. Interquartile range is less affected by changes in extreme observationsarrow_forward
arrow_back_ios
arrow_forward_ios
Recommended textbooks for you
- MATLAB: An Introduction with ApplicationsStatisticsISBN:9781119256830Author:Amos GilatPublisher:John Wiley & Sons Inc
 Probability and Statistics for Engineering and th...StatisticsISBN:9781305251809Author:Jay L. DevorePublisher:Cengage Learning
 Statistics for The Behavioral Sciences (MindTap C...StatisticsISBN:9781305504912Author:Frederick J Gravetter, Larry B. WallnauPublisher:Cengage Learning
  Elementary Statistics: Picturing the World (7th E...StatisticsISBN:9780134683416Author:Ron Larson, Betsy FarberPublisher:PEARSON
 The Basic Practice of StatisticsStatisticsISBN:9781319042578Author:David S. Moore, William I. Notz, Michael A. FlignerPublisher:W. H. Freeman
 Introduction to the Practice of StatisticsStatisticsISBN:9781319013387Author:David S. Moore, George P. McCabe, Bruce A. CraigPublisher:W. H. Freeman
MATLAB: An Introduction with Applications
Statistics
ISBN:9781119256830
Author:Amos Gilat
Publisher:John Wiley & Sons Inc
Probability and Statistics for Engineering and th...
Statistics
ISBN:9781305251809
Author:Jay L. Devore
Publisher:Cengage Learning
Statistics for The Behavioral Sciences (MindTap C...
Statistics
ISBN:9781305504912
Author:Frederick J Gravetter, Larry B. Wallnau
Publisher:Cengage Learning
Elementary Statistics: Picturing the World (7th E...
Statistics
ISBN:9780134683416
Author:Ron Larson, Betsy Farber
Publisher:PEARSON
The Basic Practice of Statistics
Statistics
ISBN:9781319042578
Author:David S. Moore, William I. Notz, Michael A. Fligner
Publisher:W. H. Freeman
Introduction to the Practice of Statistics
Statistics
ISBN:9781319013387
Author:David S. Moore, George P. McCabe, Bruce A. Craig
Publisher:W. H. Freeman