A First Course in Probability (10th Edition)
10th Edition
ISBN: 9780134753119
Author: Sheldon Ross
Publisher: PEARSON
expand_more
expand_more
format_list_bulleted
Question
Example 9.6

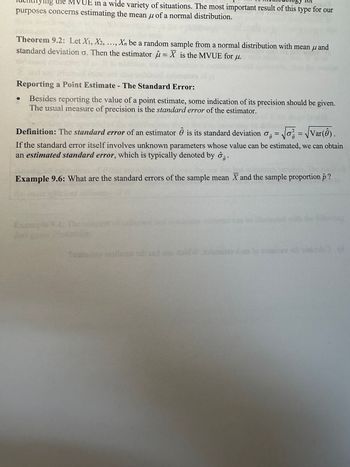
Transcribed Image Text:**Theorem 9.2:** Let \( X_1, X_2, \ldots, X_n \) be a random sample from a normal distribution with mean \( \mu \) and standard deviation \( \sigma \). Then the estimator \( \hat{\mu} = \overline{X} \) is the MVUE for \( \mu \).
**Reporting a Point Estimate - The Standard Error:**
- Besides reporting the value of a point estimate, some indication of its precision should be given. The usual measure of precision is the **standard error** of the estimator.
**Definition:** The **standard error** of an estimator \( \hat{\theta} \) is its standard deviation \( \sigma_{\hat{\theta}} = \sqrt{\sigma^2_{\hat{\theta}}} = \sqrt{\text{Var}(\hat{\theta})} \).
If the standard error itself involves unknown parameters whose value can be estimated, we can obtain an **estimated standard error**, which is typically denoted by \( \hat{\sigma}_{\hat{\theta}} \).
**Example 9.6:** What are the standard errors of the sample mean \( \overline{X} \) and the sample proportion \( \hat{p} \)?
Expert Solution
This question has been solved!
Explore an expertly crafted, step-by-step solution for a thorough understanding of key concepts.
This is a popular solution
Trending nowThis is a popular solution!
Step by stepSolved in 3 steps with 2 images

Knowledge Booster
Similar questions
- E Homework: Section 2.3 Ho... Let f= {(7, – 3),(4,6),(6, - 8)}. Find f(6). f(6) =D %3Darrow_forwardGiven the following diagrams. What is SST SSM SSR dfT dfM dfRarrow_forwardEvery day a school bus driver passes the same traffic light twice, once before school and once after. Each time he passes the light, he records if it is red, green, or yellow. Here is a summary of the data he got after 200 days. Traffic light before school red red red green green green yellow yellow yellow Traffic light after school red green yellow red green yellow red green yellow Number of days 25 38 12 34 36 11 16 13 15 Suppose the driver will continue recording the colors for 150 more days. In how many of these 150 days will the light be yellow exactly once? Use the data to make a prediction.arrow_forward
- Number of ChildrenTable 1 shows the number of women (per 1000) between 15 and 50 years of age who have been married grouped by the number of children they have had. Table 2 gives the same information for women who have never been married.1 Number of Children Women per 1000 0 162 1 213 2 344 3 182 4 69 5+ 32 Table 1 Women who have been married Number of Children Women per 1000 0 752 1 117 2 72 3 35 4 15 5+ 10 Table 2 Women who have never been married 1http://www.census.gov/hhes/fertility/data/cps/2014.html, Table 1, June 2014. Condition gt requires numbers instead of "null" and "0" (a) Without doing any calculations, which of the two samples appears to have the highest mean number of children? Women who have been marriedWomen who have never been married Which of the distributions appears to have the mean most different from the median? Women who have been marriedWomen who have never been married…arrow_forwardThe table shows the leading causes of death in a certain country in a recent year. The population of the country was 311311 million. If you lived in a typical city of 500,000, how many people would you expect to die of cancercancer each year? Cause Deaths Cause Deaths Heart disease 596 comma 700596,700 Alzheimer's disease 84 comma 90084,900 Cancer 575 comma 300575,300 Diabetes 73 comma 40073,400 Chronic respiratory diseases 143 comma 100143,100 Pneumonia/Influenza 53 comma 40053,400 Stroke 128 comma 600128,600 Kidney disease 45 comma 30045,300 Accidents 122 comma 500122,500 Suicide 38 comma 60038,600 About people would be expected to die of cancer each year. (Type a whole number. Round to the nearest person as needed.)arrow_forwardPlease see attachmentarrow_forward
- Please answer all partsarrow_forwardedo exercises 17 and 18 in section 8.1 of your textbook, about the small animal who lives in an area with woods and meadows, using the following data:If the animal is in the woods on one observation, then it is twice as likely to be in the woods as the meadows on the next observation. If the animal is in the meadows on one observation, then it is three times as likely to be in the meadows as the woods on the next observation.Assume that state 1 is being in the meadows and that state 2 is being in the woods.(1) Find the transition matrix for this Markov process. (2) If the animal is initially in the woods, what is the probability that it is in the woods on the next three observations? (3) If the animal is initially in the woods, what is the probability that it is in the meadow on the next three observations?arrow_forward
arrow_back_ios
arrow_forward_ios
Recommended textbooks for you
 A First Course in Probability (10th Edition)ProbabilityISBN:9780134753119Author:Sheldon RossPublisher:PEARSON

A First Course in Probability (10th Edition)
Probability
ISBN:9780134753119
Author:Sheldon Ross
Publisher:PEARSON
