
Advanced Engineering Mathematics
10th Edition
ISBN: 9780470458365
Author: Erwin Kreyszig
Publisher: Wiley, John & Sons, Incorporated
expand_more
expand_more
format_list_bulleted
Related questions
Question
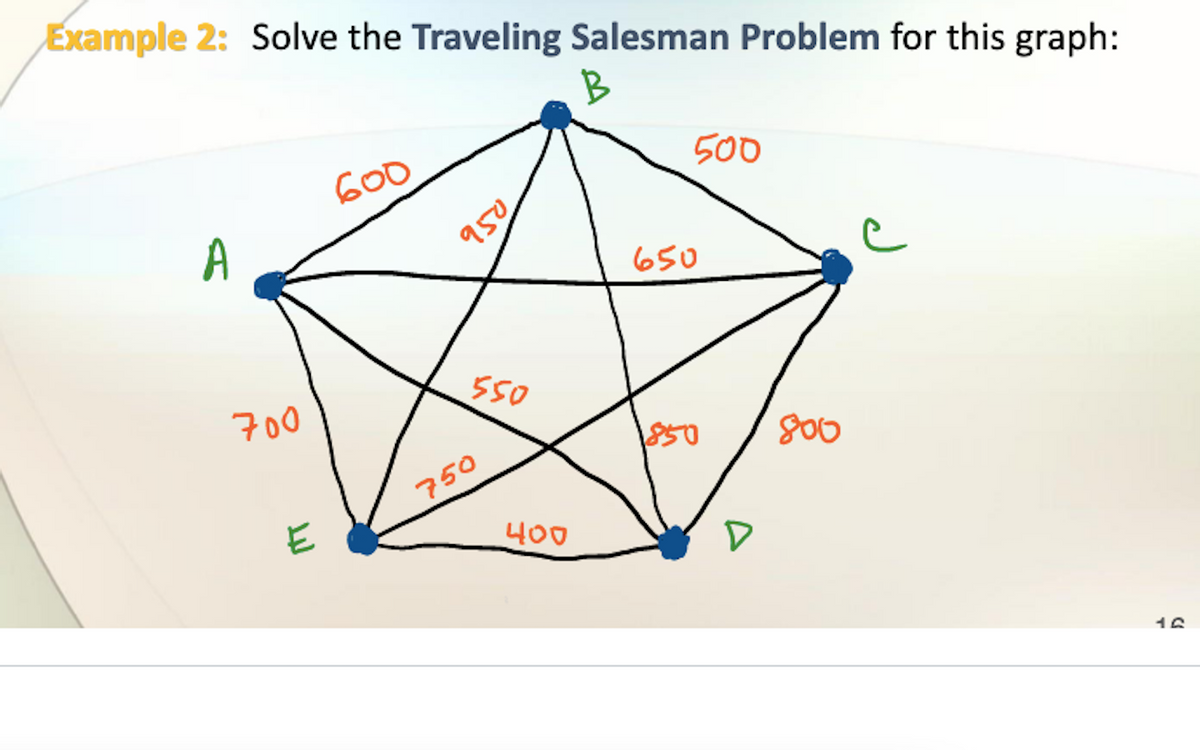

Transcribed Image Text:**Example 2: Solve the Traveling Salesman Problem for this graph**
This graph represents a network of five nodes labeled A, B, C, D, and E, with weighted edges connecting them. The weights on the edges represent the distances between nodes, which the traveler must consider when planning the most efficient route.
- **Edges and Weights:**
- A to B: 600
- A to C: 950
- A to D: 750
- A to E: 700
- B to C: 500
- B to D: 850
- B to E: 550
- C to D: 800
- C to E: 650
- D to E: 400
The objective is to find the shortest possible route that visits each node once and returns to the starting node (commonly known as solving the Traveling Salesman Problem or TSP).
Expert Solution
arrow_forward
Step 1
We will solve this problem using krukal's algorithm

Step by stepSolved in 2 steps with 1 images

Knowledge Booster

Similar questions
- Two friends, Parker and David, took summer jobs. The graph below represents David's earnings in dollars and cents, y, for working x hours. David's Earnings S600 $550 $500 $450 $400 (20,$406) $350 $300 $250 $200 (10,$203) S150 $100 $50 5 15 25 30 35 40 45 50 55 Hours Worked The table below represents Parker's earnings in dollars and cents, y, for working a hours. Parker's Earnings Hours (x) Earnings (y) 10 $226 15 $339 20 $452 25 $565 Use the dropdown menu and answer- blank below to form a true statement. Parker earns $ per hour than David. Submit Answer Earnings (Dollars)arrow_forward= #19 i Match each equation with its graph. x² + (y-1)² = 4 (x-4)² + y² = 9 x² + (y + 1)² = 4 (x + 4)² + y² = 9 y Previous H .. -4-3-2-1 4 3 2 -1 -2 8 -4 5 Y 4 2 2 1 -4 -3 -2 1 4 -2 -3 1 3 4 3 IIII xt 88 : H 4 3 2 1 X -8-7-6 -5 -4 -3 -2 -1 -1 -2 -3 y TE 3 22 -1 -2 -3 -4 y 37 2 3 45 6 1 X TT M. I Nextarrow_forwardUse the graph to determine to what age the average 15-year-old could expect to live. Life Expectancy by Age Q A 80 70- 60- 50- 40- 30- 20- 10+ to 0 10 20 30 40 50 60 70 80 Age ✔ The average 15-year-old could expect to live to years of age.arrow_forward
- Please analyze this graph. Here a example, how to analyzearrow_forwardPart A 1. Suppose that the January 2020 workload for a laboratory was: 8700 tests 10350 tests 7250 tests 4435 tests 6170 tests Hematology Clinical Chemistry Microbiology Transfusion Medicine Histotechnology Prepare a bar graph which illustrates this workload in an "easy-to-read" format. Part Barrow_forwardFind the equation of the following graph -TT/2 2 0 -2 -4 W TT/2 3TT/2 F 2TTarrow_forward
- select the correct graph #1arrow_forwardWhich of the following graphs represents the equation (x-3)² = 4(y-4)? 11 10 O 10 11 D 10 11 0 -0 4 - 2 19 d 3 -10 12TY 11 10 9 a € * 10 12 at 6 56arrow_forwardThe number of burglaries in a city is depicted in two different graphs below. Burglary Counts Graph A Burglaries 300 250 200- 150 100 50 0 Year 1 Year 2 Year 3 300 290 280 270 260 250 240 230 III II. Year 4 Year 2 Year 5 Burglary Counts Graph B 210 200 Year 1 Year 3 Year 4 Step 1 of 2: How many times more burglaries were there actually in Year 1 compared to Year 4? Round your answer to 2 decimal places. Year 5arrow_forward
- Match the equation with its graph. (x - 5)2 + (y + 6)² = 1 16 4 y y 12 12 1아 10 8 8 6F 4 4 2 2 4 6 8 10 12 -2 -12-10-8 -6 -4 -2 12-10-8-6 -4 -2 2 2 4 6 8 10 12 -4 -4 -6 -6 -8 -8 - 10 - 10 -12 -12 y y 12 12 10 10 8 6F 6F 4 4 2 2 4 6 8 10 12 2 4 6 8 10 12 -2 -12-10-8 -6 -4 -2 2 -12-10-8 -6 -4 -2 -4 -4 -6 -아 -8 -8 - 10 - 10 -12 -12 21arrow_forwardWhich of the following graphs represents the equation (X-3)²,0 (y-2)2² -1? 9 4 A -6 -6 -5 -- -3 + - -3 --2 -1 -2 -1 5 4 3 2 1 0 -1 -2 -6 5 4 2 1 0 -1 -2 -3 - & -6 5 4 Ty 3 2 1 -3 -2 -1 0 -1 N T & -6 1 1 1 2 3 4 5 3 3 4 4 5 5 6 6 6arrow_forwardI need helparrow_forward
arrow_back_ios
arrow_forward_ios
Recommended textbooks for you
- Advanced Engineering MathematicsAdvanced MathISBN:9780470458365Author:Erwin KreyszigPublisher:Wiley, John & Sons, Incorporated
 Numerical Methods for EngineersAdvanced MathISBN:9780073397924Author:Steven C. Chapra Dr., Raymond P. CanalePublisher:McGraw-Hill Education
 Introductory Mathematics for Engineering Applicat...Advanced MathISBN:9781118141809Author:Nathan KlingbeilPublisher:WILEY
  Mathematics For Machine TechnologyAdvanced MathISBN:9781337798310Author:Peterson, John.Publisher:Cengage Learning,

Advanced Engineering Mathematics
Advanced Math
ISBN:9780470458365
Author:Erwin Kreyszig
Publisher:Wiley, John & Sons, Incorporated
Numerical Methods for Engineers
Advanced Math
ISBN:9780073397924
Author:Steven C. Chapra Dr., Raymond P. Canale
Publisher:McGraw-Hill Education
Introductory Mathematics for Engineering Applicat...
Advanced Math
ISBN:9781118141809
Author:Nathan Klingbeil
Publisher:WILEY
Mathematics For Machine Technology
Advanced Math
ISBN:9781337798310
Author:Peterson, John.
Publisher:Cengage Learning,