MATLAB: An Introduction with Applications
6th Edition
ISBN: 9781119256830
Author: Amos Gilat
Publisher: John Wiley & Sons Inc
expand_more
expand_more
format_list_bulleted
Question

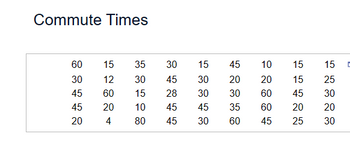
Transcribed Image Text:Commute Times
88442
60
30
45
45
20
15 35
12
30
60 15
20
10 45
4 80 45
30 15
45
10
15 15
45 30 20 20
15
25
28 30
30
60
45
30
45
35 60 20 20
30
60
45
25
30

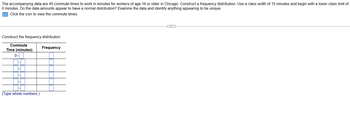
Transcribed Image Text:The accompanying data are 45 commute times to work in minutes for workers of age 16 or older in Chicago. Construct a frequency distribution. Use a class width of 15 minutes and begin with a lower class limit of
0 minutes. Do the data amounts appear to have a normal distribution? Examine the data and identify anything appearing to be unique.
Click the icon to view the commute times.
Construct the frequency distribution.
Commute
Time (minutes)
0-
(Type whole numbers.)
Frequency
Expert Solution
This question has been solved!
Explore an expertly crafted, step-by-step solution for a thorough understanding of key concepts.
This is a popular solution
Trending nowThis is a popular solution!
Step by stepSolved in 3 steps

Follow-up Questions
Read through expert solutions to related follow-up questions below.
Follow-up Question
Examine the data and identify anything appearing to be unique. Select all that apply.
The data are presented as quantitative but are actually categorical.
The unusually large value of
80
minutes appears to be an error in recording the data.Most of the data values are rounded to the nearest 5 or 10 minutes, and may be estimates of actual commute times.
Based on the gaps in the distribution, the data appear to be from two different populations.
Solution
by Bartleby Expert
Knowledge Booster
Similar questions
- The visualization given shows how much time, in hours, the 40 children in Ms. Baker's third grade class read on the weekends. Construct a relative frequency chart for this visualization. Round answers to 3 places. Number of hours Frequency (h) 0gh<1 6. 1sh<2 10 2gh<3 12 3sh<4 4 sh<5 Number of hours Relative (h) 0 sh< 1 Frequency 0.230 1 sh< 2 0.250 2 sh< 3 0.300 3 sh< 4 0.170 4sh<5 0.050 Number of hours Relative (h) Frequency O sh< 1 0.225 1 sh< 2 0.250 2 sh< 3 0.300 3 sh< 4 0.175 4 sh< 5 0.050 Number of hours Relative (h) 0 sh< 1 Frequency 0.230 1sh<2 0.250 2 sh<3 3 sh< 4 4 sh< 5 0.300 0.180 0.050 Number of hours Relative (h) 0sh<1 Frequency 0.220 1sh<2 0.250 2 sh<3 0.300 3 sh< 4 4 sh< 5 0.170 0.050arrow_forward1000 2000 3000 1000 200o 3000 1000 2000 Frequency Frequency kouanbes Frequency kouanbasarrow_forwardA frequency table of grades has five classes (A, B, C, D, F) with frequencies of 2, 14, 15, 8, and 3 respectively. Using percentages, what are the relative frequencies of the five classes? Complete the table. Grade Relative frequency A % B % C % D % F % (Round to two decimal places as needed.) Frequency 2 14 583 15arrow_forward
- A car manufacturer company shares the data of its one of the brands in 1086cc category during 2003 to 2009. The data listed in Table No.3. Table 3. The number of sales of a car in 1086cc category Year No. 1 Sales 3| 4 | 5 | 6| 7 | 3135 | 6922 | 7009| 7031| 3470| 2227| 404 2 (a) Let you are working in the data processing unit of this company. Compare years and sales by using suitable graphing technique and suggests why the company should make some changes in this product otherwise the company should discontinue the production of this model. (b) Apply a statistical technique that quantifies the relationship between the number of years and corresponding sales. Interpret the results that you obtained through statistical technique to justify your explanation.arrow_forwardAlice made a survey on the number of active Android applications her classmates have. The table summarizes the results. The Class Intervals contain the numbers of active Android Applications. The frequency is the number of students. Complete the table before answering the questions. Class Frequency Lower Class Boundary (LCB) Less than Cumulative Frequency (< cf) 50 Interval (1) 26-30 3 21-25 13 16-20 10 11-15 15 6-10 8 1-5 1 4129 47 34 1arrow_forwardState whether the variable is discrete or continuous. The temperature in degrees Fahrenheit on July 4th in Juneau, Alaskaarrow_forward
- 7. STATISTICS A class of 32 students participated in running a 400 m race in preparation for their sports day. The time, in seconds, taken by each student is recorded below. 83 34 36 @ (b) 58 82 85 82 81 80 34 82 32 72 98 73 50-54 55-59 60-64 65-69 70-74 75-79 80-84 61 78 71. Copy and complete the frequency table to represent this data. Time in seconds Frequency 3 4 6 Using the raw scores, determine the range for the data. 77887 100arrow_forward77.5 >> 84 :The data given below shows the cumulative frequency of students' grades in a class 72.5> 64 |67.5 > 46 62.5> 19 57.5> 6 Grades Cumulative Frequency Reference: freq The best graph for representing the data shown in the previous table is called .frequency polygon .A O histogram.BO .time series graph.CO .ogive.DOarrow_forwardA dosage chart tell you to take 1 3/4 mL of liquid medicine. You use this medicine once per day for three days. Which equation provides a way to find the amount of medicine in mL needed over the three days. Attend to the meanin of multiplication groups of or ofarrow_forward
- Use the Histogram tool to develop a frequency distribution and histogram for the number of months as a customer of the bank in the data below. Compute the relative and cumulative relative frequencies and use a line chart to construct an ogive. Complete the frequency distribution for the months as a customer, and compute the relative and cumulative relative frequencies. (Type integers or decimals rounded to three decimal places as needed.) Bins Frequency Relative Frequency Cumulative Relative Frequency 10 enter your response here enter your response here enter your response here 20 enter your response here enter your response here enter your response here 30 enter your response here enter your response here enter your response here 40 enter your response here enter your response here enter your response here 50 enter your response here enter your response here enter your…arrow_forwardCumulative # of Relative Frequency Relative Courses Frequency Frequency 30 0.6 15 3) Find the relative frequency for students taking 3 courses. 1. 2.arrow_forwardFill in the yellow please.arrow_forward
arrow_back_ios
SEE MORE QUESTIONS
arrow_forward_ios
Recommended textbooks for you
 MATLAB: An Introduction with ApplicationsStatisticsISBN:9781119256830Author:Amos GilatPublisher:John Wiley & Sons Inc
 Probability and Statistics for Engineering and th...StatisticsISBN:9781305251809Author:Jay L. DevorePublisher:Cengage Learning
 Statistics for The Behavioral Sciences (MindTap C...StatisticsISBN:9781305504912Author:Frederick J Gravetter, Larry B. WallnauPublisher:Cengage Learning
 Elementary Statistics: Picturing the World (7th E...StatisticsISBN:9780134683416Author:Ron Larson, Betsy FarberPublisher:PEARSON
 The Basic Practice of StatisticsStatisticsISBN:9781319042578Author:David S. Moore, William I. Notz, Michael A. FlignerPublisher:W. H. Freeman
 Introduction to the Practice of StatisticsStatisticsISBN:9781319013387Author:David S. Moore, George P. McCabe, Bruce A. CraigPublisher:W. H. Freeman

MATLAB: An Introduction with Applications
Statistics
ISBN:9781119256830
Author:Amos Gilat
Publisher:John Wiley & Sons Inc

Probability and Statistics for Engineering and th...
Statistics
ISBN:9781305251809
Author:Jay L. Devore
Publisher:Cengage Learning

Statistics for The Behavioral Sciences (MindTap C...
Statistics
ISBN:9781305504912
Author:Frederick J Gravetter, Larry B. Wallnau
Publisher:Cengage Learning

Elementary Statistics: Picturing the World (7th E...
Statistics
ISBN:9780134683416
Author:Ron Larson, Betsy Farber
Publisher:PEARSON

The Basic Practice of Statistics
Statistics
ISBN:9781319042578
Author:David S. Moore, William I. Notz, Michael A. Fligner
Publisher:W. H. Freeman

Introduction to the Practice of Statistics
Statistics
ISBN:9781319013387
Author:David S. Moore, George P. McCabe, Bruce A. Craig
Publisher:W. H. Freeman