MATLAB: An Introduction with Applications
6th Edition
ISBN: 9781119256830
Author: Amos Gilat
Publisher: John Wiley & Sons Inc
expand_more
expand_more
format_list_bulleted
Question
Solve question #5

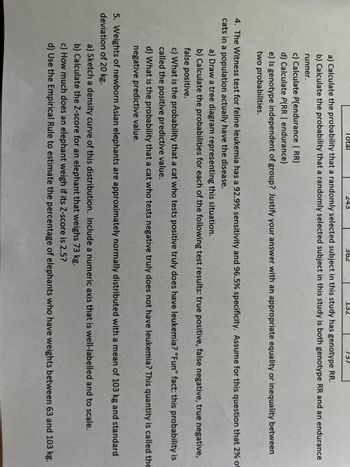
Transcribed Image Text:Total
243
362
132
737
a) Calculate the probability that a randomly selected subject in this study has genotype RR.
b) Calculate the probability that a randomly selected subject in this study is both genotype RR and an endurance
runner.
c) Calculate P(endurance | RR)
d) Calculate P(RR | endurance)
e) Is genotype independent of group? Justify your answer with an appropriate equality or inequality between
two probabilities.
4. The Witness test for feline leukemia has a 92.9% sensitivity and 96.5% specificity. Assume for this question that 2% of
cats in a population actually have the disease.
a) Draw a tree diagram representing this situation.
b) Calculate the probabilities for each of the following test results: true positive, false negative, true negative,
false positive.
c) What is the probability that a cat who tests positive truly does have leukemia? "Fun" fact: this probability is
called the positive predictive value.
d) What is the probability that a cat who tests negative truly does not have leukemia? This quantity is called the
negative predictive value.
5. Weights of newborn Asian elephants are approximately normally distributed with a mean of 103 kg and standard
deviation of 20 kg.
a) Sketch a density curve of this distribution. Include a numeric axis that is well-labelled and to scale.
b) Calculate the Z-score for an elephant that weighs 73 kg.
c) How much does an elephant weigh if its Z-score is 2.5?
d) Use the Empirical Rule to estimate the percentage of elephants who have weights between 63 and 103 kg.
Expert Solution
arrow_forward
Step 1
It is given that
Mean, μ = 103
Standard deviation, σ = 20
Step by stepSolved in 4 steps with 1 images

Knowledge Booster
Similar questions
Recommended textbooks for you
 MATLAB: An Introduction with ApplicationsStatisticsISBN:9781119256830Author:Amos GilatPublisher:John Wiley & Sons Inc
 Probability and Statistics for Engineering and th...StatisticsISBN:9781305251809Author:Jay L. DevorePublisher:Cengage Learning
 Statistics for The Behavioral Sciences (MindTap C...StatisticsISBN:9781305504912Author:Frederick J Gravetter, Larry B. WallnauPublisher:Cengage Learning
 Elementary Statistics: Picturing the World (7th E...StatisticsISBN:9780134683416Author:Ron Larson, Betsy FarberPublisher:PEARSON
 The Basic Practice of StatisticsStatisticsISBN:9781319042578Author:David S. Moore, William I. Notz, Michael A. FlignerPublisher:W. H. Freeman
 Introduction to the Practice of StatisticsStatisticsISBN:9781319013387Author:David S. Moore, George P. McCabe, Bruce A. CraigPublisher:W. H. Freeman

MATLAB: An Introduction with Applications
Statistics
ISBN:9781119256830
Author:Amos Gilat
Publisher:John Wiley & Sons Inc

Probability and Statistics for Engineering and th...
Statistics
ISBN:9781305251809
Author:Jay L. Devore
Publisher:Cengage Learning

Statistics for The Behavioral Sciences (MindTap C...
Statistics
ISBN:9781305504912
Author:Frederick J Gravetter, Larry B. Wallnau
Publisher:Cengage Learning

Elementary Statistics: Picturing the World (7th E...
Statistics
ISBN:9780134683416
Author:Ron Larson, Betsy Farber
Publisher:PEARSON

The Basic Practice of Statistics
Statistics
ISBN:9781319042578
Author:David S. Moore, William I. Notz, Michael A. Fligner
Publisher:W. H. Freeman

Introduction to the Practice of Statistics
Statistics
ISBN:9781319013387
Author:David S. Moore, George P. McCabe, Bruce A. Craig
Publisher:W. H. Freeman