
MATLAB: An Introduction with Applications
6th Edition
ISBN: 9781119256830
Author: Amos Gilat
Publisher: John Wiley & Sons Inc
expand_more
expand_more
format_list_bulleted
Related questions
Question
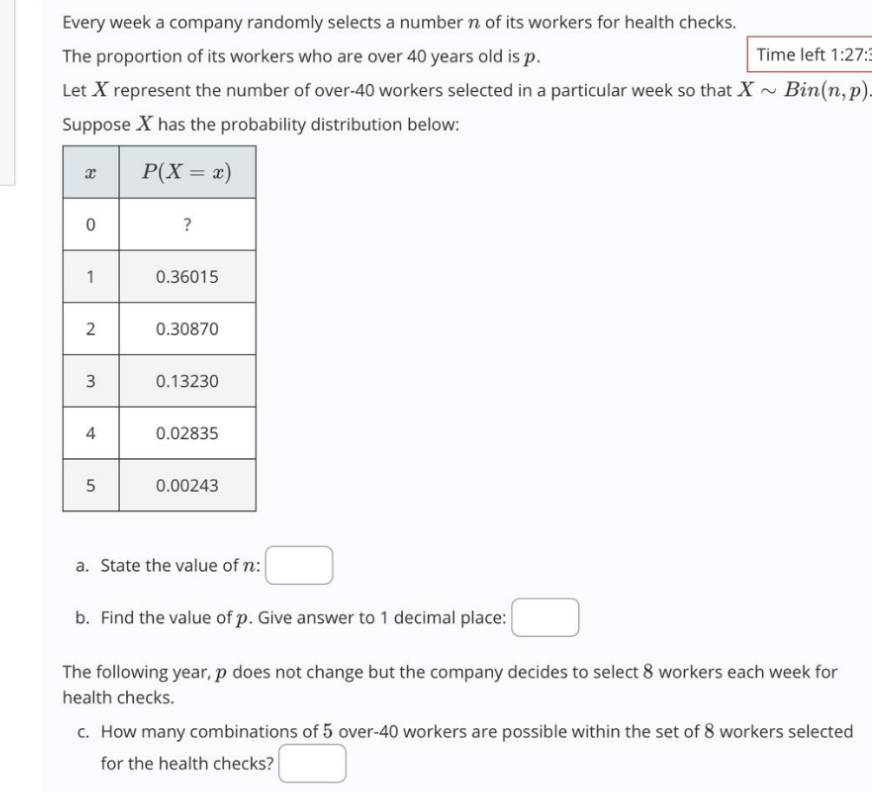

Transcribed Image Text:Every week a company randomly selects a number n of its workers for health checks.
The proportion of its workers who are over 40 years old is p.
Time left 1:27:3
2
Let X represent the number of over-40 workers selected in a particular week so that X ~ Bin(n,p).
Suppose Xhas the probability distribution below:
x
P(X = x)
0
?
1
0.36015
2
0.30870
3
0.13230
4
0.02835
5
0.00243
a. State the value of n:
b. Find the value of p. Give answer to 1 decimal place:
The following year, p does not change but the company decides to select 8 workers each week for
health checks.
c. How many combinations of 5 over-40 workers are possible within the set of 8 workers selected
for the health checks?
Expert Solution
This question has been solved!
Explore an expertly crafted, step-by-step solution for a thorough understanding of key concepts.

Step by stepSolved in 1 steps

Knowledge Booster

Similar questions
- The joint probability distribution of the number X of cars and the number Y of buses per signal cycle at a proposed left-turn lane is displayed in the accompanying joint probability table below. y P(xy) 1 2. 0. .025 .015 .010 .050 .030 020 2. .125 .075 050 3. 150 090 060 4. 100 .060 040 050 .030 .020 Suppose the left-turn lane is to have a capacity of six cars, and that one bus is equivalent to three cars. What is the probability of an overflow duringa cycle? Select one: O 48 O 28 O38 0.18arrow_forwardA deck of four (4) cards has exactly one (1) color printed on each face – blue, yellow, red, or green. You have two (2) identical decks of this type. In this game, you randomly select a card from each of the two decks. Your score is the number of blue cards drawn – refer to this quantity as X. The probability distribution is below: X P(X) 0 0.5625 1 0.375 2 0.0625 What is the average number of blue cards drawn? What is the probability that at most one blue card is drawn?arrow_forwardFor familiés with 5 children, let X be the number of children with Genetic Condition B. Can the following table be a probability distribution for the random variable X? P(x) 1 0.2862 0.0776 3. 0.1155 4 0.0491 0.3974 O no O yes 2.arrow_forward
- Prob-1 Probability that cars have been assembled in a particular plant as follows: P(plant1) =20%, P(plant2)=24%, P(plant3)=25%, P(plant4)=31%. Total number of cars manufactured by all plants: 1.2 million/year. Number of cars of no warranty claims manufactured by plant1: 223200/year. Compute the warranty claim rate of the cars assembled in plant1? C: warranty Claim rate NC: No warranty claim rate= 1- C P1 20% Total Cars Manufactured C = P2 NC 24% P3 P4 .% 25% 31% C NC C C Z NC .NCarrow_forwardAnswer 1&2 plzarrow_forwardMegan has purchased the insurance policy from an insurance company to cover the value of hers new car in case if it gets totaled for the price of $1500 per year. Megan's car worth $20000 and the probability of her totaling the car during the length of the policy is estimated to be 0.4%. Let XX be the insurance company's profit. Answer the following questions: 1. Create the probability distribution table for XX : XX outcome profit xx ,$ P(X=x)P(X=x) car is totaled car is not totaled 2. Use the probability distribution table to find the following: E[X]=μX=E[X]=μX= dollars. (Round the answer to 1 decimal place.) SD[X]=σX=SD[X]=σX= dollars. (Round the answer to 1 decimal place.)arrow_forward
- A student who is taking a stats class was assigned to watch the cars driving along Pereira Drive and count the number of people who are in each cars. Let Y be the number of people in a given car that the student observe. The following table shows the cdf of Y: 1 3 4 P(Y < y) 0.06 0.32 0.71 0.88 1 (a) What is the probability that a given car has 2 people in it? (b) What is the probability that a give car has 3 or more people in it. (c) What is the expected number of people in a given car that the student observe.arrow_forwardSuppose the time it takes for guests to wait for an elevator at the lobby of a certain office building has a uniform distribution between 0 and 4 minutes. What is the probability that, the next time you need to take this elevator, you'll have to wait at most 1.6 minutes? (Your answer should be a decimal. Round to 4 decimal places if necessary.)arrow_forwardAn appliance dealer sells three different models of upright freezers having 11.5, 14.9, and 20.1 cubic feet of storage space. Let x = the amount of storage space purchased by the next customer to buy a freezer. Suppose that x has the following probability distribution. X p(x) 11.5 14.9 20.1 0.2 0.5 0.3 (a) Calculate the mean (in cubic feet) of x. cubic feet Calculate the standard deviation (in cubic feet) of x. (Round your answer to three decimal places.) cubic feet (b) If the price of the freezer depends on the size of the storage space, x, such that Price = 25x8.5, what is the mean price paid (in dollars) by the next customer? $ (c) What is the standard deviation of the price paid (in dollars)? (Round your answer to the nearest cent.) $arrow_forward
- action=edit&resid=C08701F6876D7727!330&ithint=file%2cdocx&action=edit&wdNewAndOpenCt=1654742848849&wd Previous Ses 1. The following table shows the probability distribution for X = the number of traffic accidents reported in a day in a small city in the Rockies. X P(X) 0 0.25 1 0.30 0.20 0.10 0.10 5 0.05 a. What is the mear or expected number of accidents? b. What is the standard deviation of the number of accidents? an alarm in the presence of 2 3 4arrow_forward1arrow_forward
arrow_back_ios
arrow_forward_ios
Recommended textbooks for you
- MATLAB: An Introduction with ApplicationsStatisticsISBN:9781119256830Author:Amos GilatPublisher:John Wiley & Sons Inc
 Probability and Statistics for Engineering and th...StatisticsISBN:9781305251809Author:Jay L. DevorePublisher:Cengage Learning
 Statistics for The Behavioral Sciences (MindTap C...StatisticsISBN:9781305504912Author:Frederick J Gravetter, Larry B. WallnauPublisher:Cengage Learning
  Elementary Statistics: Picturing the World (7th E...StatisticsISBN:9780134683416Author:Ron Larson, Betsy FarberPublisher:PEARSON
 The Basic Practice of StatisticsStatisticsISBN:9781319042578Author:David S. Moore, William I. Notz, Michael A. FlignerPublisher:W. H. Freeman
 Introduction to the Practice of StatisticsStatisticsISBN:9781319013387Author:David S. Moore, George P. McCabe, Bruce A. CraigPublisher:W. H. Freeman
MATLAB: An Introduction with Applications
Statistics
ISBN:9781119256830
Author:Amos Gilat
Publisher:John Wiley & Sons Inc
Probability and Statistics for Engineering and th...
Statistics
ISBN:9781305251809
Author:Jay L. Devore
Publisher:Cengage Learning
Statistics for The Behavioral Sciences (MindTap C...
Statistics
ISBN:9781305504912
Author:Frederick J Gravetter, Larry B. Wallnau
Publisher:Cengage Learning
Elementary Statistics: Picturing the World (7th E...
Statistics
ISBN:9780134683416
Author:Ron Larson, Betsy Farber
Publisher:PEARSON
The Basic Practice of Statistics
Statistics
ISBN:9781319042578
Author:David S. Moore, William I. Notz, Michael A. Fligner
Publisher:W. H. Freeman
Introduction to the Practice of Statistics
Statistics
ISBN:9781319013387
Author:David S. Moore, George P. McCabe, Bruce A. Craig
Publisher:W. H. Freeman