
MATLAB: An Introduction with Applications
6th Edition
ISBN: 9781119256830
Author: Amos Gilat
Publisher: John Wiley & Sons Inc
expand_more
expand_more
format_list_bulleted
Related questions
Question
a. What are the null and alternative hypotheses?
b. determine the test statistic
c. determine the p-value
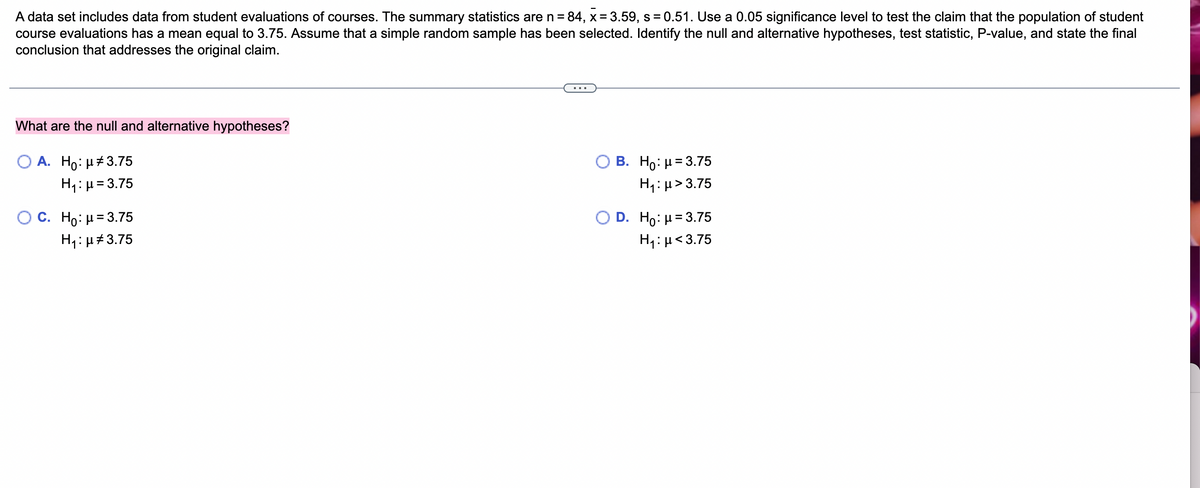

Transcribed Image Text:A data set includes data from student evaluations of courses. The summary statistics are n = 84, x = 3.59, s = 0.51. Use a 0.05 significance level to test the claim that the population of student
course evaluations has a mean equal to 3.75. Assume that a simple random sample has been selected. Identify the null and alternative hypotheses, test statistic, P-value, and state the final
conclusion that addresses the original claim.
What are the null and alternative hypotheses?
O A. Ho: μ#3.75
H₁: μ = 3.75
O C. Ho: μ = 3.75
H₁:μ#3.75
B. Ho: μ = 3.75
H₁:μ>3.75
D. Ho: μ = 3.75
Hy:μ<3.75
Expert Solution
This question has been solved!
Explore an expertly crafted, step-by-step solution for a thorough understanding of key concepts.

Step by stepSolved in 3 steps

Knowledge Booster

Similar questions
- Calculate the test statistic x2 and the pvaluearrow_forwardn a study of 817 randomly selected medical malpractice lawsuits, it was found that 484 of them were dropped or dismissed. Use a 0.05 significance level to test the claim that most medical malpractice lawsuits are dropped or dismissed. Which of the following is the hypothesis test to be conducted? A. Upper H 0 : p less than 0.5 Upper H 1 : p equals 0.5 B. Upper H 0 : p equals 0.5 Upper H 1 : p greater than 0.5 Your answer is correct. C. Upper H 0 : p equals 0.5 Upper H 1 : p less than 0.5 D. Upper H 0 : p equals 0.5 Upper H 1 : p not equals 0.5 E. Upper H 0 : p not equals 0.5 Upper H 1 : p equals 0.5 F. Upper H 0 : p greater than 0.5 Upper H 1 : p equals 0.5 What is the test statistic? z = p-value = conclusionarrow_forwardThe null and alternate hypotheses are: He: T1 T₂ H₁: T₁ T₂ A sample of 100 observations from the first population indicated that x₁ is 70. A sample of 150 observations from the second population revealed x₂ to be 90. Use the 0.05 significance level to test the hypothesis. a. State the decision rule. (Round your answer to 2 decimal places.) HO is rejected if z> b. Compute the pooled proportion. (Round your answer to 2 decimal places.) Pooled proportionarrow_forward
- B. Identify the test statistic. z=___ C. Identify the P-value. P-value=___ D. What is the conclusion based on the hypothesis test? The P-value is (greater than/ less than) the significance level of α=0.05, so (reject/ fail to reject) the null hypothesis. There (suffiecient/ is not sufficient) evidence to warrant rejection of the claim that women and men have equal success in challenging calls. Test the claim by constructing an appropriate confidence interval. The 95% confidence interval is___<(p1-p2)<____. E. What is the conclusion based on the confidence interval? Because the confidence interval limits (include/ do not include) 0, there (does/ does not) appear to be a significant difference between the two proportions. There (is sufficient/ is not sufficient) evidence to warrant rejection of the claim that men and women have equal success in challenging calls. F. Based on the results, does it appear that men and women may have equal success in challenging…arrow_forwardsuppose a hypothesis test is conducted where the level of significance a= 0.05 and the test results in p- value = 0.04 should the researcher reject the null hypothesis? A. yes because the p-value is less than a b. no should not reject because the p-value is greater than a c. no should not reject because is less than a d. yes should reject because the p-value is greater than aarrow_forwardPerform the test of hypothesis on the following scenarios. A brand of powdered milk is advertised as having a net weight of 250 grams. A curious consumer obtained the net weight of 10 randomly selected cans. The values obtained are 256, 248, 242, 245, 246, 248, 250, 255, 243, and 249 grams. Is there reason to believe that the average net weight of the powdered milk cans is less than 250 grams at 10% level of significance? Assume the net weight is normally distributed with unknown population variance. Note: pls follow the given steps in the photo attachedarrow_forward
- In a study of 819 randomly selected medical malpractice lawsuits, it was found that 473 of them were dropped or dismissed. Use a 0.01 significance level to test the claim that most medical malpractice lawsuits are dropped or dismissed. Which of the following is the hypothesis test to be conducted? ОА. Но: р30.5 H;: p> 0.5 ОС. Но: р0.5 H1: p= 0.5 OF. Ho: p= 0.5 ОЕ. Но: р-0.5 H1: p#0.5 H1: p<0.5 What is the test statistic? (Round to two decimal places as needed.) What is the P-value? P-value = (Round to three decimal places as needed.)arrow_forwardThe data below show sport preference and age of participant from a random sample of members of a sports club. Is there evidence to suggest that they are related? Frequencies of Sport Preference and Age Tennis Swimming Basketball 18-25 97 86 72 26-30 91 78 54 31-40 68 72 50 Over 40 67 58 43 What can be concluded at the a = 0.10 significance level?arrow_forwardB. Identify the test statistic Z=___ C. Identify the P-value. P-value=___ D. What is the conclusion based on the hypothesis test? The P-value is (greater than/less than) the significance level of α=0.01,so (reject/ fail to reject) the null hypothesis. There is (suffiecient/ insufficient) evidence to support the claim that the proportion of people over 55 who dream in black and white is greater than the proportion for those under 25. Test the claim by constructing an appropriate confidence interval. The 90% confidence interval is ___<( p1-p2)<___ E. Because the confidence interval limits (do not include/include) 0, it appears that the two proportions are (equal/not equal) Because the confidence interval limits include (only negative/ only positive/ negative and positive) values, it appears that the proportion of people over 55 who dream in black and white is (greater than/less than/ not significantly different from) the proportion for those under 25. F. An explanation…arrow_forward
- A. Identify the test statistic test B. Identify the P-value for this hypothesis test C. If P-value is reject H0 or fail to reject H0 D. Do the results support the belief that 50.8% of newborn babies are boys?arrow_forwardAccording to a recent study in New York, 15% of shoppers are unfairly being charged sales tax in non-taxable items. Mr. Hypothesis feels this proportion is too low. He tests his belief by conducting a survey of 200 random shoppers. Which of the following is the null hypothesis? a. The percent of shoppers unfairly being charged sales tax on non-taxable items < .15 b. The percent of shoppers unfairly being charged sales tax on non-taxable items > .15 c. The percent of shoppers unfairly being charged sales tax on non-taxable items = .15arrow_forwardYou wish to test the following claim (Ha) at a significance level of a = 0.01. H.: u = 78.5 H.:u < 78.5 You believe the population is normally distributed, but you do not know the standard deviation. You obtain the following sample of data: data 64.5 63.5 72.4 68.2 58.3 65 What is the test statistic for this sample? (Report answer accurate to three decimal places.) test statistic = What is the p-value for this sample? (Report answer accurate to four decimal places.) p-value = The p-value is... O less than (or equal to) a O greater than aarrow_forward
arrow_back_ios
SEE MORE QUESTIONS
arrow_forward_ios
Recommended textbooks for you
- MATLAB: An Introduction with ApplicationsStatisticsISBN:9781119256830Author:Amos GilatPublisher:John Wiley & Sons Inc
 Probability and Statistics for Engineering and th...StatisticsISBN:9781305251809Author:Jay L. DevorePublisher:Cengage Learning
 Statistics for The Behavioral Sciences (MindTap C...StatisticsISBN:9781305504912Author:Frederick J Gravetter, Larry B. WallnauPublisher:Cengage Learning
  Elementary Statistics: Picturing the World (7th E...StatisticsISBN:9780134683416Author:Ron Larson, Betsy FarberPublisher:PEARSON
 The Basic Practice of StatisticsStatisticsISBN:9781319042578Author:David S. Moore, William I. Notz, Michael A. FlignerPublisher:W. H. Freeman
 Introduction to the Practice of StatisticsStatisticsISBN:9781319013387Author:David S. Moore, George P. McCabe, Bruce A. CraigPublisher:W. H. Freeman
MATLAB: An Introduction with Applications
Statistics
ISBN:9781119256830
Author:Amos Gilat
Publisher:John Wiley & Sons Inc
Probability and Statistics for Engineering and th...
Statistics
ISBN:9781305251809
Author:Jay L. Devore
Publisher:Cengage Learning
Statistics for The Behavioral Sciences (MindTap C...
Statistics
ISBN:9781305504912
Author:Frederick J Gravetter, Larry B. Wallnau
Publisher:Cengage Learning
Elementary Statistics: Picturing the World (7th E...
Statistics
ISBN:9780134683416
Author:Ron Larson, Betsy Farber
Publisher:PEARSON
The Basic Practice of Statistics
Statistics
ISBN:9781319042578
Author:David S. Moore, William I. Notz, Michael A. Fligner
Publisher:W. H. Freeman
Introduction to the Practice of Statistics
Statistics
ISBN:9781319013387
Author:David S. Moore, George P. McCabe, Bruce A. Craig
Publisher:W. H. Freeman