
MATLAB: An Introduction with Applications
6th Edition
ISBN: 9781119256830
Author: Amos Gilat
Publisher: John Wiley & Sons Inc
expand_more
expand_more
format_list_bulleted
Related questions
Question
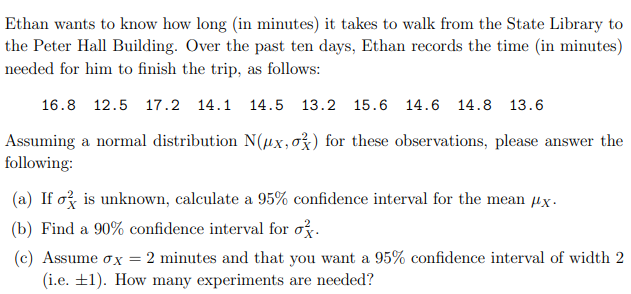

Transcribed Image Text:Ethan wants to know how long (in minutes) it takes to walk from the State Library to
the Peter Hall Building. Over the past ten days, Ethan records the time (in minutes)
needed for him to finish the trip, as follows:
16.8 12.5 17.2 14.1 14.5 13.2 15.6 14.6 14.8 13.6
Assuming a normal distribution N(ux,o3) for these observations, please answer the
following:
(a) If o? is unknown, calculate a 95% confidence interval for the mean µx.
(b) Find a 90% confidence interval for o.
(c) Assume ox = 2 minutes and that you want a 95% confidence interval of width 2
(i.e. ±1). How many experiments are needed?
Expert Solution
This question has been solved!
Explore an expertly crafted, step-by-step solution for a thorough understanding of key concepts.

Step by stepSolved in 2 steps with 2 images

Knowledge Booster

Similar questions
- he quantitative data set under consideration has roughly a bell-shaped distribution. Apply the empirical rule to answer the following question. A quantitative data set has mean 20 and standard deviation 1. Approximately what percentage of the observations lie between 17 and 23?arrow_forwardThe shape of a given population distribution is normal with a mean of μ = 85 and a standard deviation of o= 6.5. For these parameters, transform a raw score of X = 100.5 into its corresponding z score. Round to the nearest tenths place if a fraction. The z score is: O 2.4 -3.7 -3.4 09.2 The correct z-score is not listed.arrow_forwardThe lifetimes of certain flies are approximately normally distributed with mean μ=1530 minutes and σ=59 minutes. What is the 6th percentile for the life expectancy of these flies? Round your answer to the nearest hundredth of a minute. 6th percentile:arrow_forward
- The blood pressure in millimeters was measured for a large sample of people. The average pressure is 140 mm, and the SD of the measurements is 20 mm. The histogram looks reasonably like a normal curv Use the normal curve to estimate the following percentages. Choose the answer that is closest to being correct. A 19.1% B 30.9% C 38.2% D 69.1% E 68.27% A The percentage of people with blood pressure between 130 and 150 mm. B The percentage of people with blood pressure between 140 and 150 mm. D The percentage of people with blood pressure over 150 mm.arrow_forwardThe data represents the heights of eruptions by a geyser. ← Use the heights to construct a stem and leaf plot. Is there strong evidence suggesting that the data are not from a population having a normal distribution? Which plot represents a correct stem and leaf plot of the data? O A. 910 10 0 1 3 689 110034 12 0 0 1 13 0 0 0 1 14 0 15 0 OB. 9/0 ⒸA. 6 B. 1 OC. 4 OD. 5 10 0 1 11 00001 12 03 6 89 13 0 0 3 4 14 01 15 0 O C. 9|001 10 0 18 11 0 0 3 12 0 0 9 13 0 0 6 14 034 15 0 1 If there were a 200 foot eruption, how many stems would it add to the chart above? Save Height of eruption (in.) 128 90 110 150 140 110 100 130 110 123 134 111 110 126 129 120 133 130 101 141 ww Incorarrow_forwardEstimate the distance traveled in 20 seconds given the following sample velocities using right- endpoint values. Be sure to write the units for your answer. Time (s) 10 15 20 Velocity (m/s) 3 3.4 2.9 2.4 1arrow_forward
arrow_back_ios
arrow_forward_ios
Recommended textbooks for you
- MATLAB: An Introduction with ApplicationsStatisticsISBN:9781119256830Author:Amos GilatPublisher:John Wiley & Sons Inc
 Probability and Statistics for Engineering and th...StatisticsISBN:9781305251809Author:Jay L. DevorePublisher:Cengage Learning
 Statistics for The Behavioral Sciences (MindTap C...StatisticsISBN:9781305504912Author:Frederick J Gravetter, Larry B. WallnauPublisher:Cengage Learning
  Elementary Statistics: Picturing the World (7th E...StatisticsISBN:9780134683416Author:Ron Larson, Betsy FarberPublisher:PEARSON
 The Basic Practice of StatisticsStatisticsISBN:9781319042578Author:David S. Moore, William I. Notz, Michael A. FlignerPublisher:W. H. Freeman
 Introduction to the Practice of StatisticsStatisticsISBN:9781319013387Author:David S. Moore, George P. McCabe, Bruce A. CraigPublisher:W. H. Freeman
MATLAB: An Introduction with Applications
Statistics
ISBN:9781119256830
Author:Amos Gilat
Publisher:John Wiley & Sons Inc
Probability and Statistics for Engineering and th...
Statistics
ISBN:9781305251809
Author:Jay L. Devore
Publisher:Cengage Learning
Statistics for The Behavioral Sciences (MindTap C...
Statistics
ISBN:9781305504912
Author:Frederick J Gravetter, Larry B. Wallnau
Publisher:Cengage Learning
Elementary Statistics: Picturing the World (7th E...
Statistics
ISBN:9780134683416
Author:Ron Larson, Betsy Farber
Publisher:PEARSON
The Basic Practice of Statistics
Statistics
ISBN:9781319042578
Author:David S. Moore, William I. Notz, Michael A. Fligner
Publisher:W. H. Freeman
Introduction to the Practice of Statistics
Statistics
ISBN:9781319013387
Author:David S. Moore, George P. McCabe, Bruce A. Craig
Publisher:W. H. Freeman