MATLAB: An Introduction with Applications
6th Edition
ISBN: 9781119256830
Author: Amos Gilat
Publisher: John Wiley & Sons Inc
expand_more
expand_more
format_list_bulleted
Concept explainers
Question

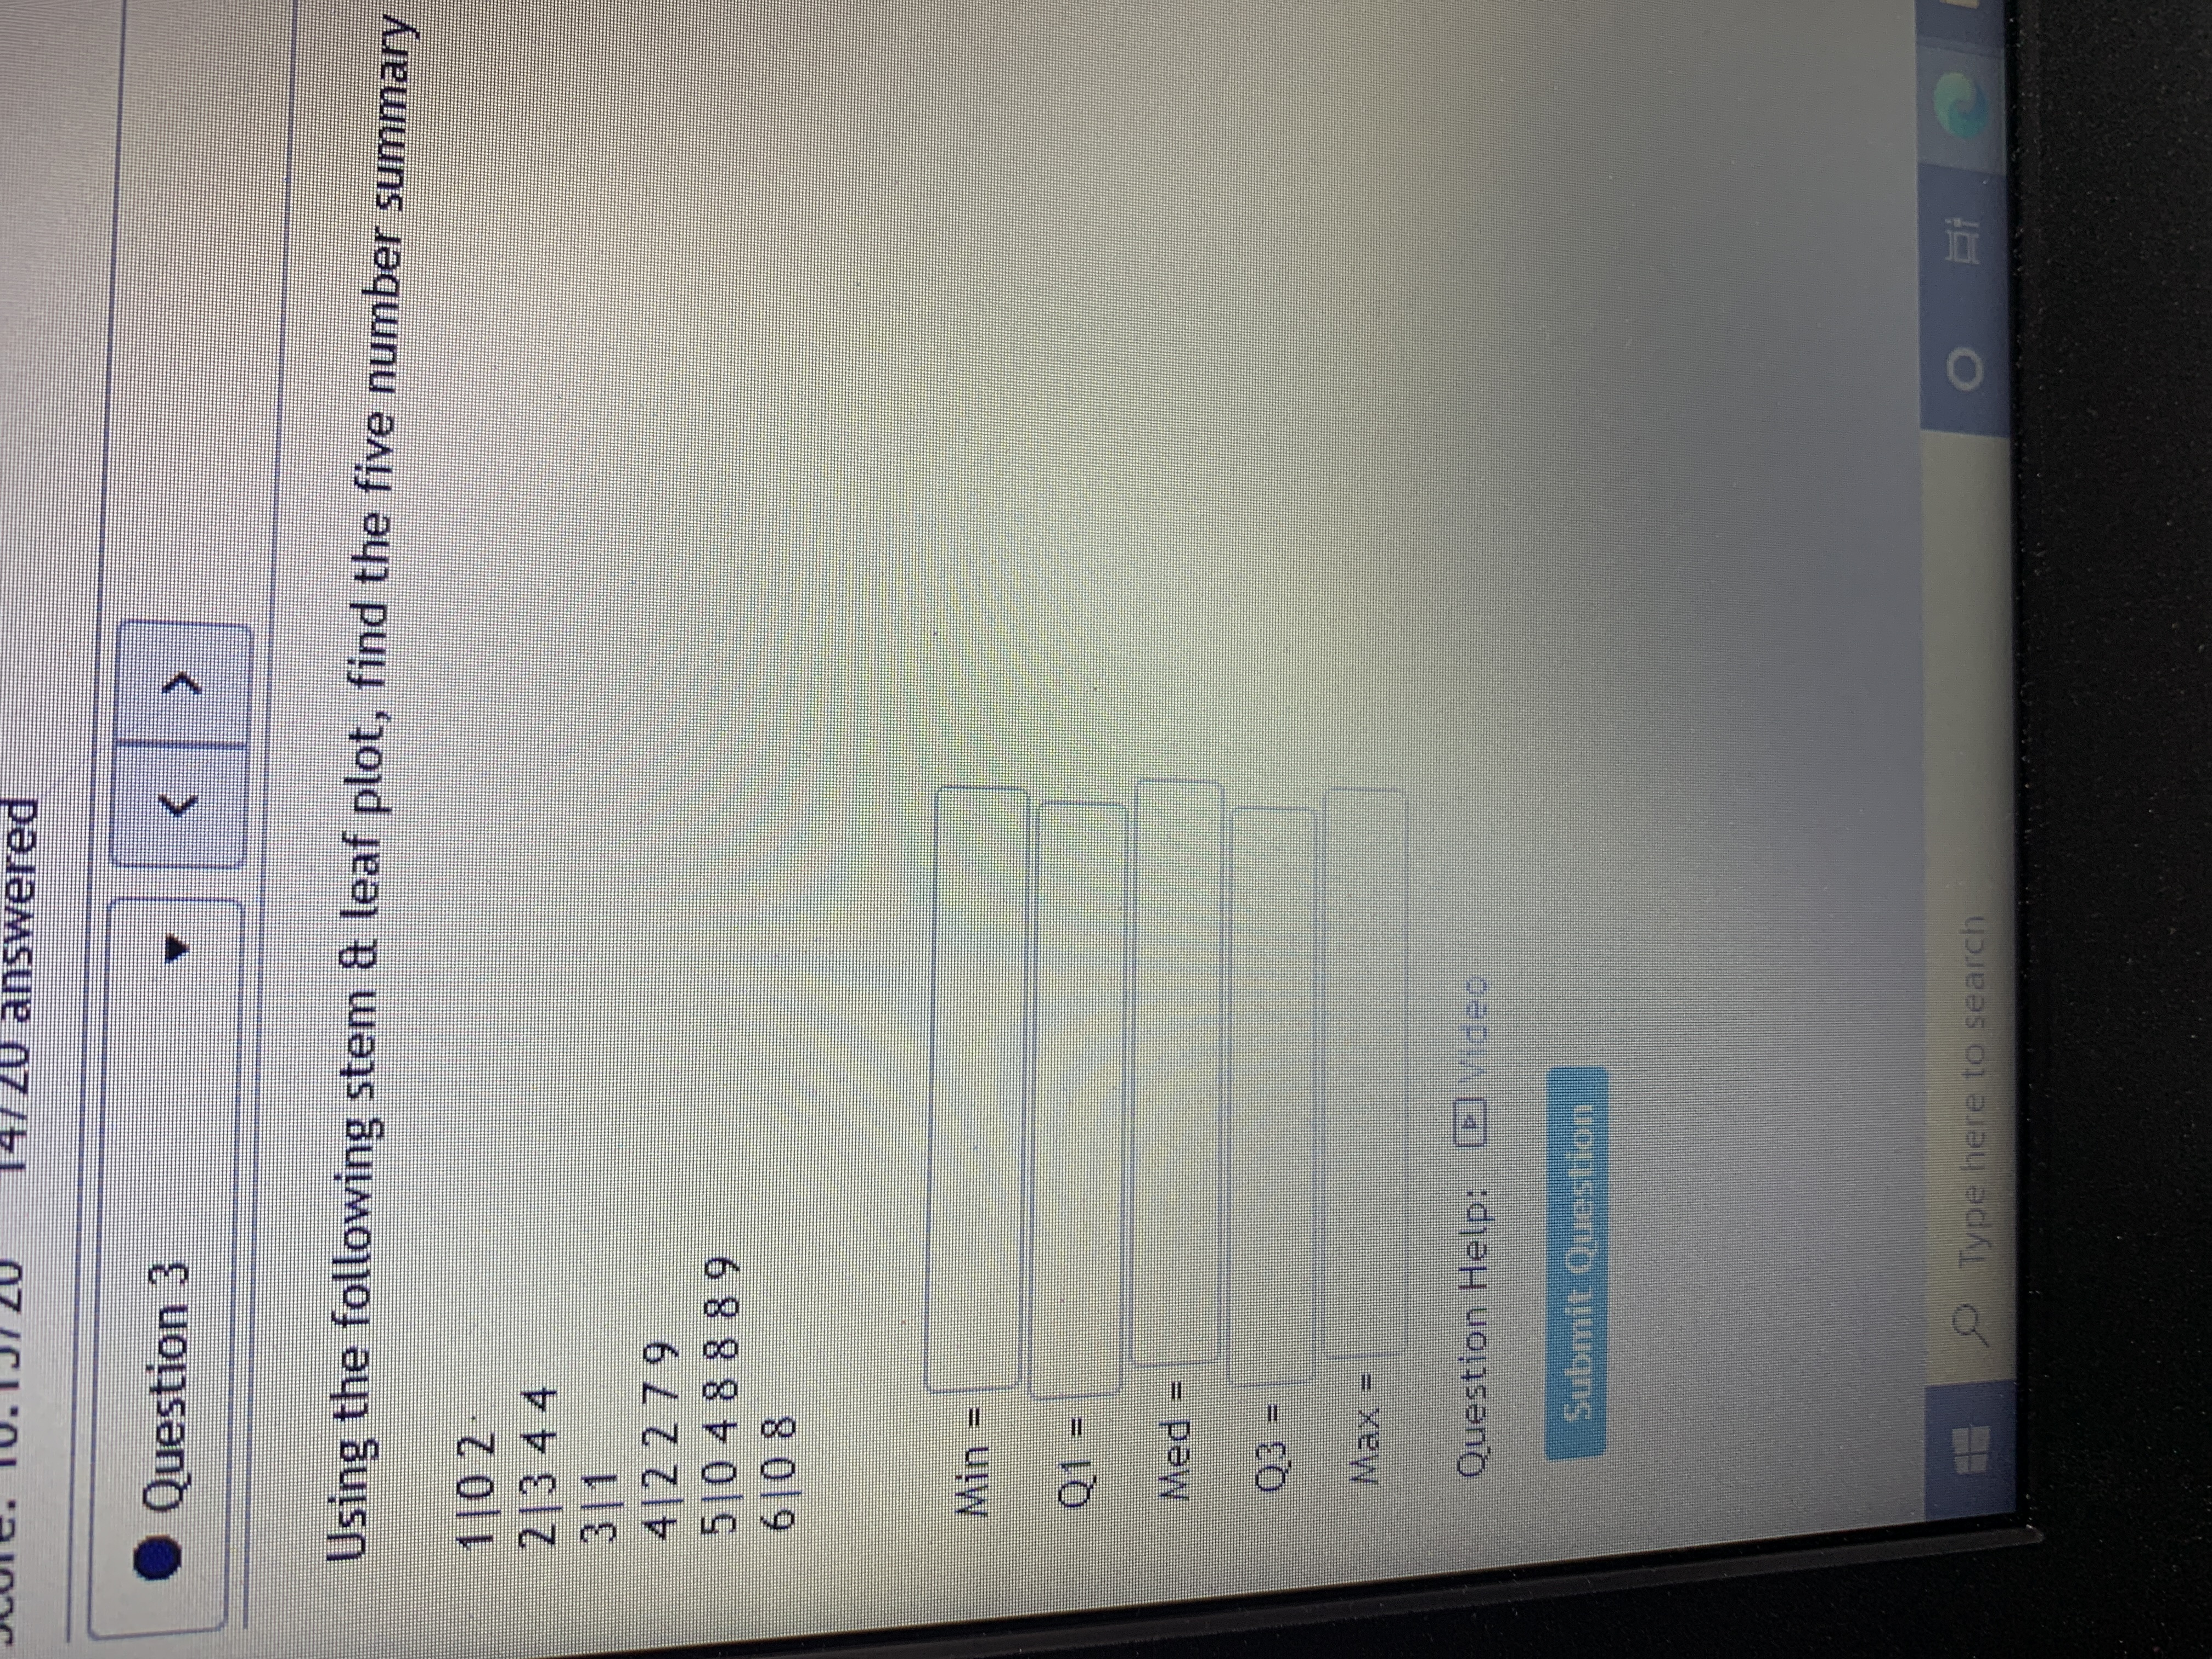
Transcribed Image Text:estion 3
the following stem & leaf plot, find the five nur
Expert Solution
This question has been solved!
Explore an expertly crafted, step-by-step solution for a thorough understanding of key concepts.
Step by stepSolved in 2 steps

Knowledge Booster
Learn more about
Need a deep-dive on the concept behind this application? Look no further. Learn more about this topic, statistics and related others by exploring similar questions and additional content below.Similar questions
- a) The following variables represent numbers ranked from lowest to highest: A, B, C, D.Write the expression to find the median of these variables. b) For the same variables, write an expression to find the mean of these variables.arrow_forwardThe last digit of the heights of 40 statistics students were obtained as part of an experiment conducted for a class. Use the following frequency distribution to construct a histogram. What can be concluded from the distribution of the digits? Specifically, do the heights appear to be reported or actually measured? Digit Frequency 0 1 2 4 3 1 Choose the correct histogram below. O A. O B. O C. O D. TH 0123456789 HOLG 12- HH 123456789 Are the data reported or measured? O A. The data appears to be measured. The heights occur with roughly the same frequency. O B. The data appears to be measured. Certain heights occur a disproportionate number of times.arrow_forwardUse the box-and-whisker plot to identify the five-number summary. 891 2140 1201 1476 1904 900 1200 1500 1800 2100 漸 拼 Min3D orearrow_forward
- Complete the Table Below:arrow_forwardWhich choice correctly describes the shape of this histogram? a.symmetric b.uniform c.skewed right d.skewed leftarrow_forwardClasses Basketball 8 Football 2 Cricket 4 Swimming 11 5 Tennis Frequency Angle on the pie chart Total 6. Complete the table above and create a pie chart.arrow_forward
- Matharrow_forwardIf P(A)=0.5, P(B)=0.3, and A and B are independent, find P(A and B). Question content area bottom Part 1 P(A and B)=?arrow_forwardDuring the 2016-2017 season, the University of South Carolina Men's Basketball team made it to the final 4. The Lady Gamecocks made it to the final four and won the National Championship. Below are the number of points each team scored during each of the games they played during the 2016-2017 season. Use the back-to-back stem and leaf plot to answer the questions. How many games did each team play? The men played ___ and the women played ___ games. What is the mean points of each team? The men scored an average of ___ points and the women scored an average of ____ points (round to the nearest point) What is the range of the points of each team? The men scored a range of ____ points and the women scored a range of ____ points. What is the population standard deviation for each team? The men had a standard deviation of _____ points and the women had a standard deviation of _____ points (round to nearest hundredth). Based on the standard deviation, which team's points varied more?…arrow_forward
arrow_back_ios
arrow_forward_ios
Recommended textbooks for you
 MATLAB: An Introduction with ApplicationsStatisticsISBN:9781119256830Author:Amos GilatPublisher:John Wiley & Sons Inc
 Probability and Statistics for Engineering and th...StatisticsISBN:9781305251809Author:Jay L. DevorePublisher:Cengage Learning
 Statistics for The Behavioral Sciences (MindTap C...StatisticsISBN:9781305504912Author:Frederick J Gravetter, Larry B. WallnauPublisher:Cengage Learning
 Elementary Statistics: Picturing the World (7th E...StatisticsISBN:9780134683416Author:Ron Larson, Betsy FarberPublisher:PEARSON
 The Basic Practice of StatisticsStatisticsISBN:9781319042578Author:David S. Moore, William I. Notz, Michael A. FlignerPublisher:W. H. Freeman
 Introduction to the Practice of StatisticsStatisticsISBN:9781319013387Author:David S. Moore, George P. McCabe, Bruce A. CraigPublisher:W. H. Freeman

MATLAB: An Introduction with Applications
Statistics
ISBN:9781119256830
Author:Amos Gilat
Publisher:John Wiley & Sons Inc

Probability and Statistics for Engineering and th...
Statistics
ISBN:9781305251809
Author:Jay L. Devore
Publisher:Cengage Learning

Statistics for The Behavioral Sciences (MindTap C...
Statistics
ISBN:9781305504912
Author:Frederick J Gravetter, Larry B. Wallnau
Publisher:Cengage Learning

Elementary Statistics: Picturing the World (7th E...
Statistics
ISBN:9780134683416
Author:Ron Larson, Betsy Farber
Publisher:PEARSON

The Basic Practice of Statistics
Statistics
ISBN:9781319042578
Author:David S. Moore, William I. Notz, Michael A. Fligner
Publisher:W. H. Freeman

Introduction to the Practice of Statistics
Statistics
ISBN:9781319013387
Author:David S. Moore, George P. McCabe, Bruce A. Craig
Publisher:W. H. Freeman