es from a February day, draw isotherms (isopleths of temperature) for 0°F and all other isotherms at intervals of 10°F. Don't forget units on your labels. Label your contours. When completed, you should have the following contours: -10F, OF, 10F, 20F, 30F, 40F, 50F, 60F, 70F and 80F. Download the Contour Map. You can then print this image and hand draw the contours in pencil, or copy it into a drawing program like paint and contour it on your computer. Once finished, save the image, or take a picture of it with your phone and upload your completed map. V -15 -8
es from a February day, draw isotherms (isopleths of temperature) for 0°F and all other isotherms at intervals of 10°F. Don't forget units on your labels. Label your contours. When completed, you should have the following contours: -10F, OF, 10F, 20F, 30F, 40F, 50F, 60F, 70F and 80F. Download the Contour Map. You can then print this image and hand draw the contours in pencil, or copy it into a drawing program like paint and contour it on your computer. Once finished, save the image, or take a picture of it with your phone and upload your completed map. V -15 -8

Applications and Investigations in Earth Science (9th Edition)
9th Edition
ISBN:9780134746241
Author:Edward J. Tarbuck, Frederick K. Lutgens, Dennis G. Tasa
Publisher:Edward J. Tarbuck, Frederick K. Lutgens, Dennis G. Tasa
Chapter1: The Study Of Minerals
Section: Chapter Questions
Problem 1LR

Related questions
Question
Q2. Select one answer.
According to your contoured map, which state has the largest temperature gradient?
A. Florida
B. North Carolina
C. Colorado
D. Minnesota
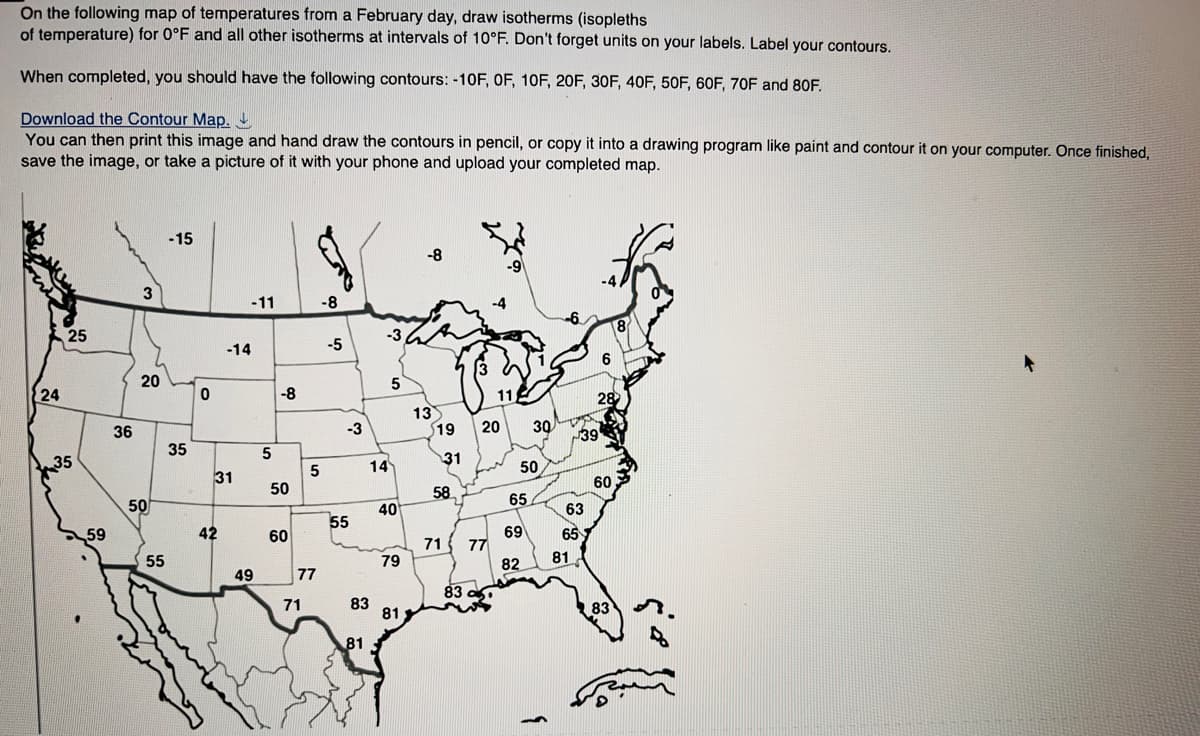
Transcribed Image Text:On the following map of temperatures from a February day, draw isotherms (isopleths
of temperature) for 0°F and all other isotherms at intervals of 10°F. Don't forget units on your labels. Label your contours.
When completed, you should have the following contours: -10F, OF, 10F, 20F, 30F, 40F, 50F, 60F, 70F and 80F.
Download the Contour Map.
You can then print this image and hand draw the contours in pencil, or copy it into a drawing program like paint and contour it on your computer. Once finished,
save the image, or take a picture of it with your phone and upload your completed map.
24
25
35
59
36
3
20
50
55
-15
35
0
-14
31
42
-11
49
5
-8
50
60
5
77
71
-8
-5
-3
55
83
81
-3
14
5
40
79
81
-8
13
$19
31
58
71 77
83
115
20 30
50
65
69
82
63
65
81
39
6
28
60
8
83
Expert Solution
This question has been solved!
Explore an expertly crafted, step-by-step solution for a thorough understanding of key concepts.

This is a popular solution!

Trending now
This is a popular solution!

Step by step
Solved in 3 steps

Recommended textbooks for you
Applications and Investigations in Earth Science …
Earth Science
ISBN:
9780134746241
Author:
Edward J. Tarbuck, Frederick K. Lutgens, Dennis G. Tasa
Publisher:
PEARSON

Exercises for Weather & Climate (9th Edition)
Earth Science
ISBN:
9780134041360
Author:
Greg Carbone
Publisher:
PEARSON

Environmental Science
Earth Science
ISBN:
9781260153125
Author:
William P Cunningham Prof., Mary Ann Cunningham Professor
Publisher:
McGraw-Hill Education
Applications and Investigations in Earth Science …
Earth Science
ISBN:
9780134746241
Author:
Edward J. Tarbuck, Frederick K. Lutgens, Dennis G. Tasa
Publisher:
PEARSON
Exercises for Weather & Climate (9th Edition)
Earth Science
ISBN:
9780134041360
Author:
Greg Carbone
Publisher:
PEARSON
Environmental Science
Earth Science
ISBN:
9781260153125
Author:
William P Cunningham Prof., Mary Ann Cunningham Professor
Publisher:
McGraw-Hill Education

Earth Science (15th Edition)
Earth Science
ISBN:
9780134543536
Author:
Edward J. Tarbuck, Frederick K. Lutgens, Dennis G. Tasa
Publisher:
PEARSON

Environmental Science (MindTap Course List)
Earth Science
ISBN:
9781337569613
Author:
G. Tyler Miller, Scott Spoolman
Publisher:
Cengage Learning

Physical Geology
Earth Science
ISBN:
9781259916823
Author:
Plummer, Charles C., CARLSON, Diane H., Hammersley, Lisa
Publisher:
Mcgraw-hill Education,