MATLAB: An Introduction with Applications
6th Edition
ISBN: 9781119256830
Author: Amos Gilat
Publisher: John Wiley & Sons Inc
expand_more
expand_more
format_list_bulleted
Question
Make it so i could copy and paste it.

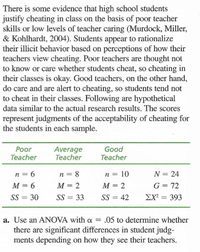
Transcribed Image Text:There is some evidence that high school students
justify cheating in class on the basis of poor teacher
skills or low levels of teacher caring (Murdock, Miller,
& Kohlhardt, 2004). Students appear to rationalize
their illicit behavior based on perceptions of how their
teachers view cheating. Poor teachers are thought not
to know or care whether students cheat, so cheating in
their classes is okay. Good teachers, on the other hand,
do care and are alert to cheating, so students tend not
to cheat in their classes. Following are hypothetical
data similar to the actual research results. The scores
represent judgments of the acceptability of cheating for
the students in each sample.
Good
Teacher
Poor
Average
Teacher
Teacher
n = 6
n = 8
n = 10
N = 24
M = 6
М — 2
М — 2
G = 72
SS = 30
SS = 33
SS = 42
EX? = 393
%3D
a. Use an ANOVA with a = .05 to determine whether
there are significant differences in student judg-
ments depending on how they see their teachers.
Expert Solution
This question has been solved!
Explore an expertly crafted, step-by-step solution for a thorough understanding of key concepts.
Step by stepSolved in 2 steps with 2 images

Knowledge Booster
Similar questions
- could you do this on a piece of paper so that its easier to understand?arrow_forwardThe locations of a spider (S) and its prey (P) are shown on the box below. The spider is on the front of the box, 1" from the bottom and 1" from the left side. The prey is on the back of the box 1" from the top and 1" from the right. The front, top and bottom sides of the box are 2" X 3". The left and right sides of the box are each 2" X 2". Find the shortest distance the spider must travel to get its prey. Find this length.arrow_forwardsolve. x4-362+35=0arrow_forward
arrow_back_ios
arrow_forward_ios
Recommended textbooks for you
 MATLAB: An Introduction with ApplicationsStatisticsISBN:9781119256830Author:Amos GilatPublisher:John Wiley & Sons Inc
 Probability and Statistics for Engineering and th...StatisticsISBN:9781305251809Author:Jay L. DevorePublisher:Cengage Learning
 Statistics for The Behavioral Sciences (MindTap C...StatisticsISBN:9781305504912Author:Frederick J Gravetter, Larry B. WallnauPublisher:Cengage Learning
 Elementary Statistics: Picturing the World (7th E...StatisticsISBN:9780134683416Author:Ron Larson, Betsy FarberPublisher:PEARSON
 The Basic Practice of StatisticsStatisticsISBN:9781319042578Author:David S. Moore, William I. Notz, Michael A. FlignerPublisher:W. H. Freeman
 Introduction to the Practice of StatisticsStatisticsISBN:9781319013387Author:David S. Moore, George P. McCabe, Bruce A. CraigPublisher:W. H. Freeman

MATLAB: An Introduction with Applications
Statistics
ISBN:9781119256830
Author:Amos Gilat
Publisher:John Wiley & Sons Inc

Probability and Statistics for Engineering and th...
Statistics
ISBN:9781305251809
Author:Jay L. Devore
Publisher:Cengage Learning

Statistics for The Behavioral Sciences (MindTap C...
Statistics
ISBN:9781305504912
Author:Frederick J Gravetter, Larry B. Wallnau
Publisher:Cengage Learning

Elementary Statistics: Picturing the World (7th E...
Statistics
ISBN:9780134683416
Author:Ron Larson, Betsy Farber
Publisher:PEARSON

The Basic Practice of Statistics
Statistics
ISBN:9781319042578
Author:David S. Moore, William I. Notz, Michael A. Fligner
Publisher:W. H. Freeman

Introduction to the Practice of Statistics
Statistics
ISBN:9781319013387
Author:David S. Moore, George P. McCabe, Bruce A. Craig
Publisher:W. H. Freeman