
MATLAB: An Introduction with Applications
6th Edition
ISBN: 9781119256830
Author: Amos Gilat
Publisher: John Wiley & Sons Inc
expand_more
expand_more
format_list_bulleted
Related questions
Question
Need help with a and b please and thank you. Please show work.
![2. The following stemplot gives data on the hemoglobin levels (in g/dL) for 22 randomly selected cats. In
this stemplot, 5|8 represents a hemoglobin level of 5.8 g/dL.
5|8
61
7|78
8|79
91455669
10|03678
11|027
12|
13|04
14|1
a) [3 pts] The 5-number summary is given below. Fill in the missing information. Use the method
discussed in the textbook and course videos for finding Q3 by hand.
Q1
Median
Q3
Мax
Minimum
5.8
14.1
9.4
determine (by hand) whether or not
b)
there are any outliers. If so, what values are they? Show your calculations!](https://content.bartleby.com/qna-images/question/6f79dac5-2fbe-42d7-a6cd-6c9f52e4d201/39aa87f0-dfd0-4dc7-b0db-72eb69fbdb6a/p5xw3ud_processed.jpeg)

Transcribed Image Text:2. The following stemplot gives data on the hemoglobin levels (in g/dL) for 22 randomly selected cats. In
this stemplot, 5|8 represents a hemoglobin level of 5.8 g/dL.
5|8
61
7|78
8|79
91455669
10|03678
11|027
12|
13|04
14|1
a) [3 pts] The 5-number summary is given below. Fill in the missing information. Use the method
discussed in the textbook and course videos for finding Q3 by hand.
Q1
Median
Q3
Мax
Minimum
5.8
14.1
9.4
determine (by hand) whether or not
b)
there are any outliers. If so, what values are they? Show your calculations!
Expert Solution
arrow_forward
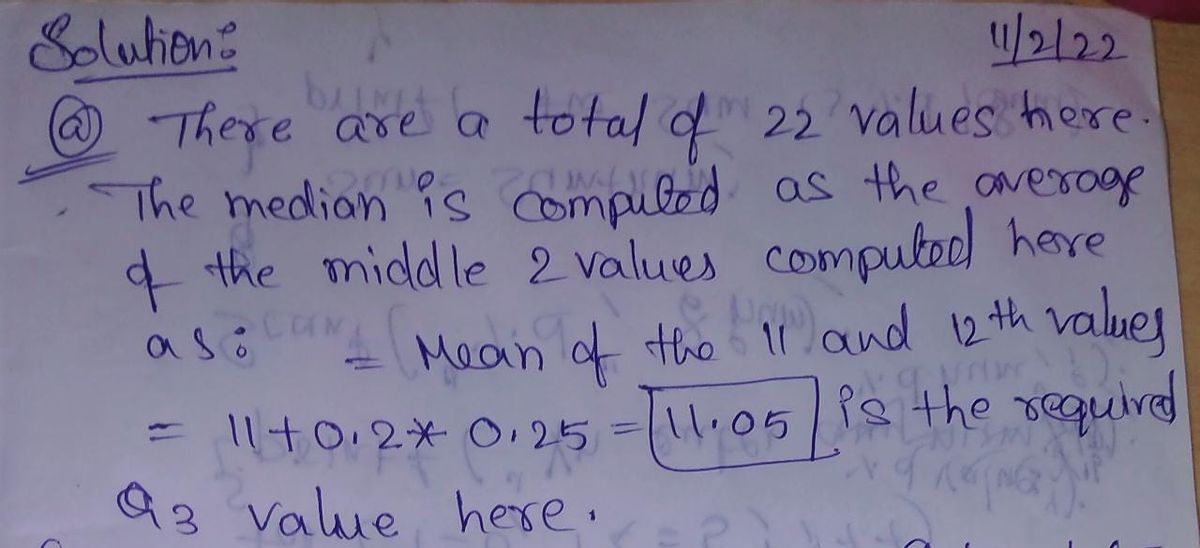
Step 1

Trending nowThis is a popular solution!

Step by stepSolved in 2 steps with 2 images

Knowledge Booster

Similar questions
- Please do not give solution in image format thanku You want to host a giveaway on Facebook to promote your new side hustle. You are giving away a $50 gift card for your business. Anyone who likes/follows your Facebook page is entered into the drawing. According to a recent study, you predict your side hustle will earn, on average, $.50 per like/follow. Your giveaway deadline passes, and you have 189 new followers on your Facebook page since the giveaway was first promoted. Using expected value, answer the following: Was this a successful giveaway (in terms of expected value)? How many followers would have made this giveaway a “fair game”? What would the expected value have been if you only gained 94 new followers?arrow_forwardHelparrow_forwardSubtract. 9. -4- 6.arrow_forward
arrow_back_ios
arrow_forward_ios
Recommended textbooks for you
- MATLAB: An Introduction with ApplicationsStatisticsISBN:9781119256830Author:Amos GilatPublisher:John Wiley & Sons Inc
 Probability and Statistics for Engineering and th...StatisticsISBN:9781305251809Author:Jay L. DevorePublisher:Cengage Learning
 Statistics for The Behavioral Sciences (MindTap C...StatisticsISBN:9781305504912Author:Frederick J Gravetter, Larry B. WallnauPublisher:Cengage Learning
  Elementary Statistics: Picturing the World (7th E...StatisticsISBN:9780134683416Author:Ron Larson, Betsy FarberPublisher:PEARSON
 The Basic Practice of StatisticsStatisticsISBN:9781319042578Author:David S. Moore, William I. Notz, Michael A. FlignerPublisher:W. H. Freeman
 Introduction to the Practice of StatisticsStatisticsISBN:9781319013387Author:David S. Moore, George P. McCabe, Bruce A. CraigPublisher:W. H. Freeman
MATLAB: An Introduction with Applications
Statistics
ISBN:9781119256830
Author:Amos Gilat
Publisher:John Wiley & Sons Inc
Probability and Statistics for Engineering and th...
Statistics
ISBN:9781305251809
Author:Jay L. Devore
Publisher:Cengage Learning
Statistics for The Behavioral Sciences (MindTap C...
Statistics
ISBN:9781305504912
Author:Frederick J Gravetter, Larry B. Wallnau
Publisher:Cengage Learning
Elementary Statistics: Picturing the World (7th E...
Statistics
ISBN:9780134683416
Author:Ron Larson, Betsy Farber
Publisher:PEARSON
The Basic Practice of Statistics
Statistics
ISBN:9781319042578
Author:David S. Moore, William I. Notz, Michael A. Fligner
Publisher:W. H. Freeman
Introduction to the Practice of Statistics
Statistics
ISBN:9781319013387
Author:David S. Moore, George P. McCabe, Bruce A. Craig
Publisher:W. H. Freeman