
MATLAB: An Introduction with Applications
6th Edition
ISBN: 9781119256830
Author: Amos Gilat
Publisher: John Wiley & Sons Inc
expand_more
expand_more
format_list_bulleted
Related questions
Question
In recent years, approximately 55% of eligible voters take the time to vote in presidential elections. A poll based on a random sample of 200 eligible voters finds that 128 plan to vote in the next presidential election.
Does this data provide convincing evidence at the ?α = 0.05 level that the proportion of eligible voters who will take time to vote in the next presidential election differs from 0.55?
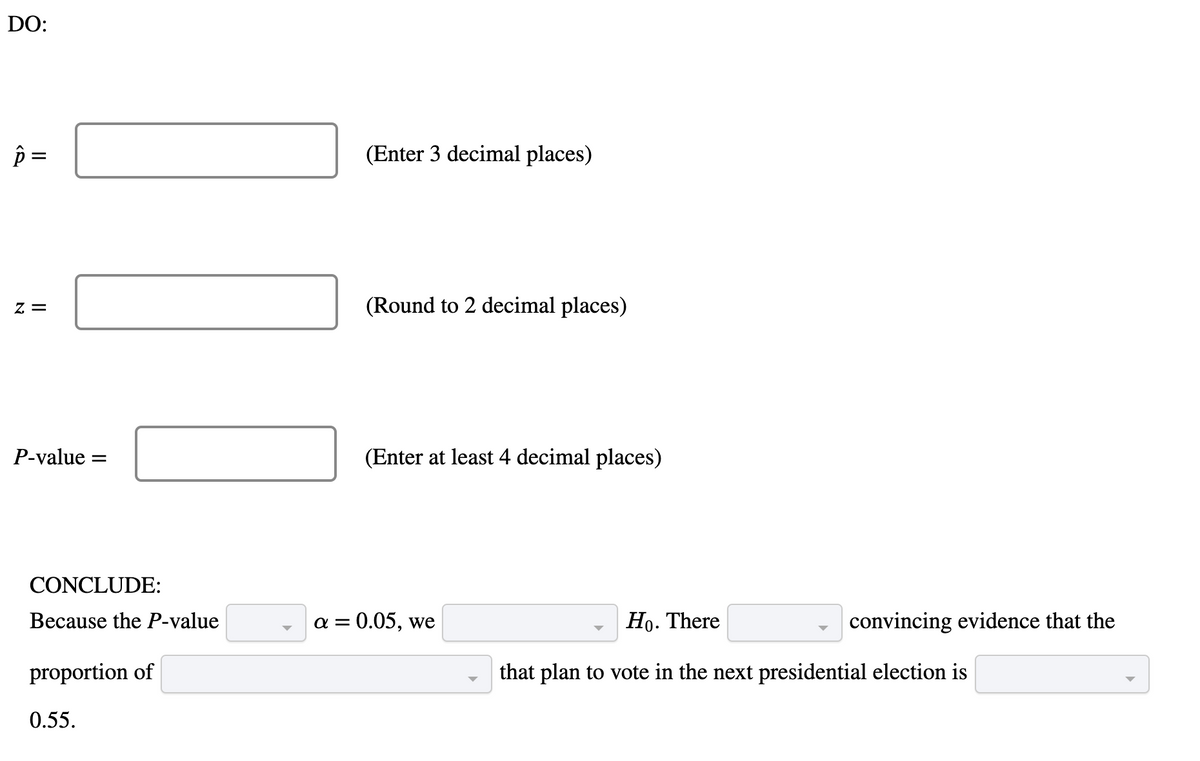

Transcribed Image Text:DO:
(Enter 3 decimal places)
z =
(Round to 2 decimal places)
P-value =
(Enter at least 4 decimal places)
CONCLUDE:
Because the P-value
a = 0.05, we
Но. There
convincing evidence that the
proportion of
that plan to vote in the next presidential election is
0.55.
II
Expert Solution
This question has been solved!
Explore an expertly crafted, step-by-step solution for a thorough understanding of key concepts.

This is a popular solution

Trending nowThis is a popular solution!

Step by stepSolved in 2 steps with 1 images

Knowledge Booster

Similar questions
- According to the Pew research center 65% of US adults believe that the government should play a larger role in addressing climate change. A random sample (SRS) of 80 US adults found that 56 US adults believe that the government should play a larger role in addressing climate change. Does this indicate that population proportion of US adults who believe that the government should play a larger role in addressing climate change is MORE THAN 65%? Given: a= 0.05 level 1. List your oH and aH: (symbols and words) 2. State and Check the conditions for the test: 3. Use the information in question: Identify the hypotheses being tested: Find your SE and test statistic by hand: 4. Use the information in question: State your conclusion given 05.0 level, in a complete sentence, in the context of the problem. 5. Use the information in question. Find the 95% confidence interval by hand using: Given z*=1.96arrow_forwardThe National Collegiate Athletic Association (NCAA) measures the Graduation Success Rate (GSR), which is the percentage of eligible athletes who graduate within six years of entering college. According to the NCAA, the GSR for all scholarship athletes in a particular division is 64%. The GSR for all students in this division is 61%. Suppose the NCAA report was based on a sample of 1,000 student-athletes, of which 640 graduated within six years. Is this sufficient information to conclude that the GSR for all scholarship athletes in this division differs from 61%? Carry out the test using a Type I error rate of 0.05. What are the hypotheses for this test? O A. Ho: p# 0.61 Ha: p=0.61 OC. Ho: p > 0.61 H₁: p≤0.61 E. Ho: p=0.61 Ha: p Calculate the value of the z-statistic for this test. Z= (Round to two decimal places as needed.) What is the rejection region? Select the correct choice below and fill in the answer box(es) to complete your choice. (Round to two decimal places as needed.) O A.…arrow_forwardYou are conducting a study to see if the proportion of voters who prefer the Democratic candidate is significantly different from 54% at a level of significance of a = 0.05. According to your sample, 33 out of 56 potential voters prefer the Democratic candidate. a. For this study, we should use Select an answer b. The null and alternative hypotheses would be: Ho: ? Select an answer ✓ (please enter a decimal) H₁: ? Select an answer ✓ (Please enter a decimal) (please show your answer to 3 decimal places.) c. The test statistic?v= d. The p-value = e. The p-value is ? ✓ a (Please show your answer to 4 decimal places.)arrow_forward
- The National Academy of Science reported that 41% of research in mathematics is published by US authors. The mathematics chairperson of a prestigious university wishes to test the claim that this percentage is no longer 41%. He has no indication of whether the percentage has increased or decreased since that time. He surveys a simple random sample of 186 recent articles published by reputable mathematics research journals and finds that 92 of these articles have US authors. Does this evidence support the mathematics chairperson’s claim that the percentage is no longer 41%? Use a 0.05 level of significance. Step 1 of 3: State the null and alternative hypotheses for the test. circle the answer below. H0 p=0.41 ha: p⎯⎯⎯⎯⎯⎯⎯⎯⎯⎯⎯⎯⎯⎯⎯0.41 A.<B.≠C.> Step 2 of 3: Compute the value of the test statistic. Round your answer to two decimal places Step 3 of 3: Draw a conclusion and interpret the decision. A. We reject the null hypothesis and conclude that there is insufficient evidence at a…arrow_forwardAmong students at a nearby college, the proportion who say they’re interested in their congressional district’s election results has traditionally been 70%. After a series of lackluster debates on campus, a political scientist claims that the proportion, p, of students at the college who say they’re interested in their districts election results is now less than 70%. A pill is commissioned, and 154 out of random sample of 230 students at the college say they’re interested in their districts election results. Is there enough evidence to support the political scientist’s claim at the 0.05 level of significance? Perform a one-tailed test. Then complete the parts below. Carry your intermediate computations to three or more decimal places and round your answers as specified in the table.arrow_forwardThe National Academy of Science reported that 33 % of research in mathematics is published by US authors. The mathematics chairperson of a prestigious university wishes to test the claim that this percentage is no longer 33 %. He has no indication of whether the percentage has increased or decreased since that time. He surveys a simple random sample of 280 recent articles published by reputable mathematics research journals and finds that 108 of these articles have US authors. Does this evidence support the mathematics chairperson's claim that the percentage is no longer 33 % ? Use a 0.01 level of significance. Step 1 of 3: State the null and alternative hypotheses for the test. Fill in the blank below. Answer Ho :p = 0.33 Ha P O # ο ο ο HAV O < 0.33 Tables Keypad Keyboard Shortcutsarrow_forward
- If Miller (2008) wanted to know if males consume significantly more energy drinks than the overall population average, which of the following are the correct hypotheses?arrow_forwardAccording to Gallup's December 2004 Lifestyle poll, 55% of U.S. adults said that that they get enough sleep. A researcher, suspecting things have changed since 2004, selects a random sample of 855 U.S. adults and finds 52.3% say they get enough sleep. At the 5% level of significance is there evidence that the proportion of adults that say they get enough sleep has changed since 2004? (Complete the full four step process.) Yes Noarrow_forwardA study is to be made to estimate the proportion of residents of a certain city and its suburbs who favor the construction of a nuclear power plant near the city. How large a sample is needed if one wishes to be at least 90% confident that the estimate is within 0.03 of the true proportion of residents who favor the construction of the nuclear power plant?arrow_forward
- In 2001, the polls found that 81% of American adults believed that there was a conspiracy in the death of President Kennedy. Assume a recent poll asked 1160 American adults if they believe there was a conspiracy in the assassination and it found that 897 believe there was a conspiracy. Does the data show that the proportion of Americans who believe in this conspiracy is now lower? Test at the 9% level. What is the correct parameter symbol for this problem? What is the wording of the parameter in the context of this problem? Fill in the correct null and alternative hypotheses:arrow_forwardA 2018 Gallup poll found 20% of adults aged 18 - 29 years vape. Test the claim that the proportion of 18 - 29 year old people who vape has decreased at the 5% significance level. A July 2021 Gallup poll resulted in 17% of the 1,007 of people that age vape.arrow_forwardIndependent studies show that 26 out of 40 r/s full-time students favor a shorter semester system, while 38 out of 50 r/s part-time students favor the same. Construct a 98% c.i. for the difference between the overall percentage of full-time students favoring a shorter semester system and that of part-time students.arrow_forward
arrow_back_ios
SEE MORE QUESTIONS
arrow_forward_ios
Recommended textbooks for you
- MATLAB: An Introduction with ApplicationsStatisticsISBN:9781119256830Author:Amos GilatPublisher:John Wiley & Sons Inc
 Probability and Statistics for Engineering and th...StatisticsISBN:9781305251809Author:Jay L. DevorePublisher:Cengage Learning
 Statistics for The Behavioral Sciences (MindTap C...StatisticsISBN:9781305504912Author:Frederick J Gravetter, Larry B. WallnauPublisher:Cengage Learning
  Elementary Statistics: Picturing the World (7th E...StatisticsISBN:9780134683416Author:Ron Larson, Betsy FarberPublisher:PEARSON
 The Basic Practice of StatisticsStatisticsISBN:9781319042578Author:David S. Moore, William I. Notz, Michael A. FlignerPublisher:W. H. Freeman
 Introduction to the Practice of StatisticsStatisticsISBN:9781319013387Author:David S. Moore, George P. McCabe, Bruce A. CraigPublisher:W. H. Freeman
MATLAB: An Introduction with Applications
Statistics
ISBN:9781119256830
Author:Amos Gilat
Publisher:John Wiley & Sons Inc
Probability and Statistics for Engineering and th...
Statistics
ISBN:9781305251809
Author:Jay L. Devore
Publisher:Cengage Learning
Statistics for The Behavioral Sciences (MindTap C...
Statistics
ISBN:9781305504912
Author:Frederick J Gravetter, Larry B. Wallnau
Publisher:Cengage Learning
Elementary Statistics: Picturing the World (7th E...
Statistics
ISBN:9780134683416
Author:Ron Larson, Betsy Farber
Publisher:PEARSON
The Basic Practice of Statistics
Statistics
ISBN:9781319042578
Author:David S. Moore, William I. Notz, Michael A. Fligner
Publisher:W. H. Freeman
Introduction to the Practice of Statistics
Statistics
ISBN:9781319013387
Author:David S. Moore, George P. McCabe, Bruce A. Craig
Publisher:W. H. Freeman