
MATLAB: An Introduction with Applications
6th Edition
ISBN: 9781119256830
Author: Amos Gilat
Publisher: John Wiley & Sons Inc
expand_more
expand_more
format_list_bulleted
Related questions
Question
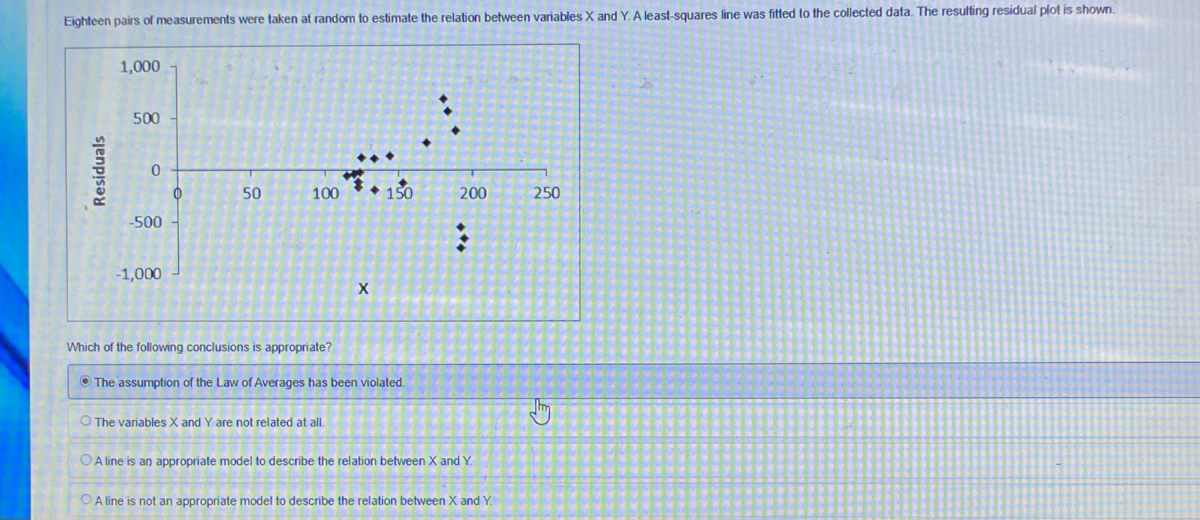

Transcribed Image Text:Eighteen pairs of measurements were taken at random to estimate the relation between variables X and Y. A least-squares line was fitted to the collected data. The resulting residual plot is shown.
Residuals
1,000
500
0
-500
-1,000
0
50
100
Which of the following conclusions is appropriate?
OA line is an
O The variables X and Y are not related at all.
X
The assumption of the Law of Averages has been violated.
150
200
:
propriate model to describe the relation between X and Y.
A line is not an appropriate model to describe the relation between X and Y.
250
Expert Solution
This question has been solved!
Explore an expertly crafted, step-by-step solution for a thorough understanding of key concepts.

This is a popular solution

Trending nowThis is a popular solution!

Step by stepSolved in 4 steps with 4 images

Knowledge Booster

Similar questions
- Look at the data below regarding the variables x = lowest barometric pressure as a cyclone approaches and y = maximum wind speed of the cyclone. Is the value of |r| large enough to conclude that lowest barometric pressure and wind speed of a cyclone are correlated? Use ? = 0.01. (Round your answer for r to four decimal places.) x 1004 975 992 935 970 928y 40 100 65 145 70 151 r = ______critical r = ______arrow_forwardK The data show the chest size and weight of several bears. Find the regression equation, letting chest size be the independent (x) variable. Then find the best predicted weight of a bear with a chest size of 63 inches. Is the result close to the actual weight of 532 pounds? Use a significance level of 0.05. Chest size (inches) Weight (pounds) Click the icon to view the critical values of the Pearson correlation coefficient r. 58 50 65 59 59 48 D 414 312 499 450 456 260 =+x (Round to one decimal place as needed.) What is the best predicted weight of a bear with a chest size of 63 inches? The best predicted weight for a bear with a chest size of 63 inches is 566 pounds. 3 ▸arrow_forwardI need help with c, d, and e, please.arrow_forward
- Consider the bivariate data shown in the table. X y Compute (x)². 8 10.2 9 9.9 10 8.6 11 7.7 12 13 6.8 5.9 14 15 4.2 3 16 2.1arrow_forwardJ 2arrow_forwardComplete parts (a) through (h) for the data below. 30 40 50 60 70 y 90 87 82 74 Question Help v 62 (c) Graph the line found in part (b) on the scatter diagram. Choose the correct graph below. O A. OB. Ay 80- OC. Ay 80- OD. Av 20- 20 20 80 100 (d) By hand, determine the least-squares regression line. /Dound to throo donimal lncon an nondod Click to select your answer(s). M acer 9 esc # 2$ 6. 4 3 e W k harrow_forward
- A researcher want to know if there is a relationship between sleep and anxiety. The researcher randomly selected n = 5 participants and asked each to rate their sleep quality and anxiety level on a scale of 1 to 5. The data are below: Sleep X Anxiety Y 2 2 3 3 2 2 4 2 5 2 Calculate the Sum of Squares for X (SSX)arrow_forwardHere is a bivariate data set. x y 37 46 43 43 63 -8 61 8 79 -38 37 56 45 44 Find the correlation coefficient and report it accurate to four decimal places.r =arrow_forward
arrow_back_ios
arrow_forward_ios
Recommended textbooks for you
- MATLAB: An Introduction with ApplicationsStatisticsISBN:9781119256830Author:Amos GilatPublisher:John Wiley & Sons Inc
 Probability and Statistics for Engineering and th...StatisticsISBN:9781305251809Author:Jay L. DevorePublisher:Cengage Learning
 Statistics for The Behavioral Sciences (MindTap C...StatisticsISBN:9781305504912Author:Frederick J Gravetter, Larry B. WallnauPublisher:Cengage Learning
  Elementary Statistics: Picturing the World (7th E...StatisticsISBN:9780134683416Author:Ron Larson, Betsy FarberPublisher:PEARSON
 The Basic Practice of StatisticsStatisticsISBN:9781319042578Author:David S. Moore, William I. Notz, Michael A. FlignerPublisher:W. H. Freeman
 Introduction to the Practice of StatisticsStatisticsISBN:9781319013387Author:David S. Moore, George P. McCabe, Bruce A. CraigPublisher:W. H. Freeman
MATLAB: An Introduction with Applications
Statistics
ISBN:9781119256830
Author:Amos Gilat
Publisher:John Wiley & Sons Inc
Probability and Statistics for Engineering and th...
Statistics
ISBN:9781305251809
Author:Jay L. Devore
Publisher:Cengage Learning
Statistics for The Behavioral Sciences (MindTap C...
Statistics
ISBN:9781305504912
Author:Frederick J Gravetter, Larry B. Wallnau
Publisher:Cengage Learning
Elementary Statistics: Picturing the World (7th E...
Statistics
ISBN:9780134683416
Author:Ron Larson, Betsy Farber
Publisher:PEARSON
The Basic Practice of Statistics
Statistics
ISBN:9781319042578
Author:David S. Moore, William I. Notz, Michael A. Fligner
Publisher:W. H. Freeman
Introduction to the Practice of Statistics
Statistics
ISBN:9781319013387
Author:David S. Moore, George P. McCabe, Bruce A. Craig
Publisher:W. H. Freeman