
MATLAB: An Introduction with Applications
6th Edition
ISBN: 9781119256830
Author: Amos Gilat
Publisher: John Wiley & Sons Inc
expand_more
expand_more
format_list_bulleted
Related questions
Topic Video
Question
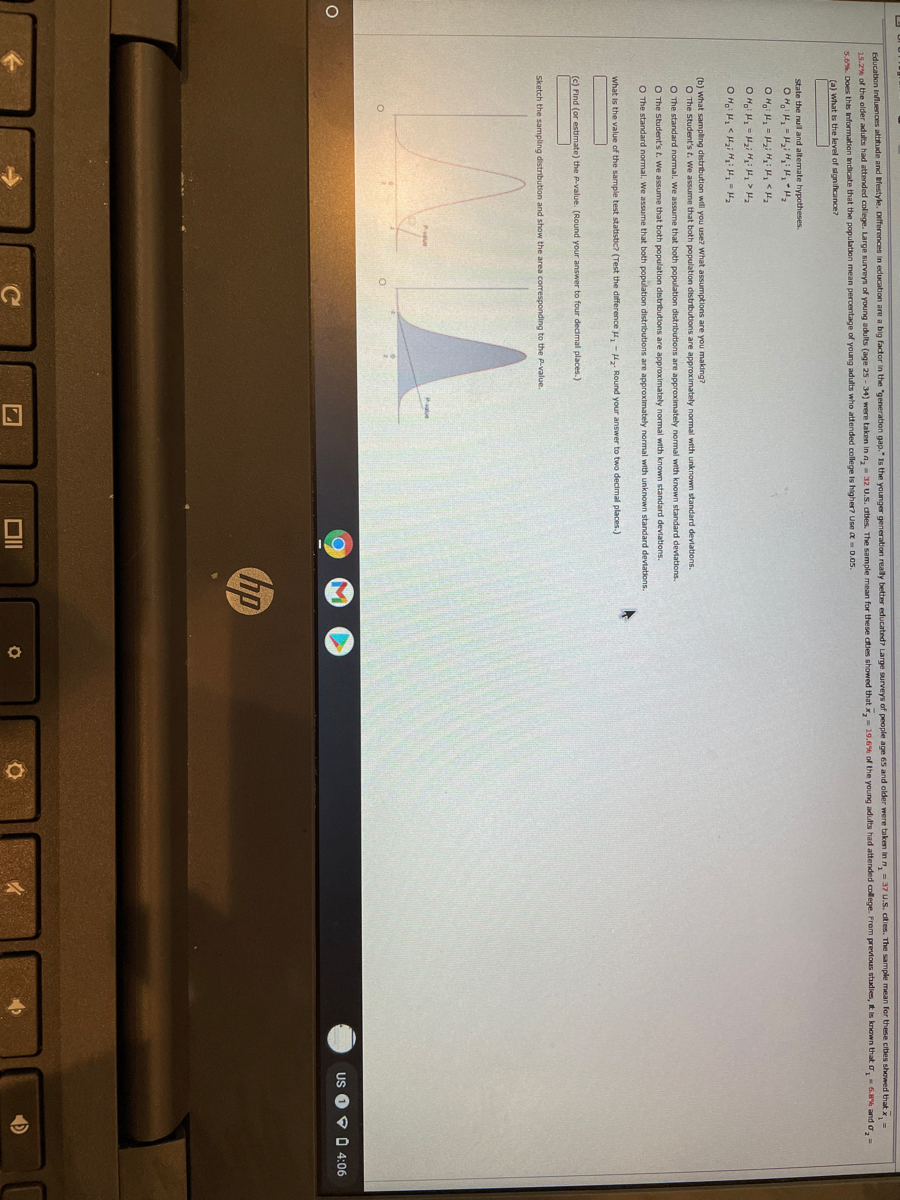

Transcribed Image Text:Education Influences attitude and festyle. Differences in education are a big factor in the "generation gap." Is the younger generation really better educated? Large surveys of people age 65 and older were taken in n, = 37 U.S. cities. The sample mean for these cities showed that x,
25.2% of the older adults had attended college. Large surveys of young adults (age 25 - 34) were taken in a,- 32 U.S. attes. The sample mean for these aties showed that x, = 19.6% of the young adults had attended college. From previous studies, t is known that o, - 6.H% and o,
5.6%. Does this Information Indicate that the population mean percentage of young adults who attended college Is higher? Use a = D.05.
(a) what is the level of signifcance?
state the null and altemate hypotheses.
O Hai H, = Hi H H, H
O H, H, <Hi H: 4, - H2
(b) what sampling distribution will you use? what assumptions are you making?
O The Student's t. We assume that both population distributions are approxcimately normal with unknown standard devlations.
O The standard normal. We assume that both population distributions are approximately normal with known standard devlations.
O The Student's t. We assume that both population distributions are approximately normal with known standard deviations.
O The standard normal, We assume that both population distributions are approximately normal with unknown standard devtations.
What is the value of the sample test statistic? (Test the difference u, - H. Round your answer to two decimal places.)
(c) Find (or estimate) the P-value. (Round your answer to four decimal places.)
Sketch the sampling distribution and show the area corresponding to the P-value.
US O 9 0 4:06
hp
Expert Solution
This question has been solved!
Explore an expertly crafted, step-by-step solution for a thorough understanding of key concepts.

Step by stepSolved in 3 steps

Knowledge Booster


Learn more about
Need a deep-dive on the concept behind this application? Look no further. Learn more about this topic, statistics and related others by exploring similar questions and additional content below.Similar questions
- How many sources of between-group variation are measured in a two-way between-subjects ANOVA? Group of answer choices a. 4 b. 2 c. 3 d. 5arrow_forward1.) The Test Statistic for this data. (Round answer to 3 decimal places). 2.) The p-value for this sample. (Round answer to 4 decimal places).arrow_forwardIn 1955, Life Magazine reported that the 25-year-old mother of three worked, on average, an 80 hour week. Recently, many groups have been studying whether or not the women’s movement has, in fact, resulted in an increase in the average work week for women (combining employment and at-home work). Suppose a study was done to determine if the mean work week has increased. 81 women were surveyed with the following results. The sample mean was 83; the sample standard deviation was ten. Does it appear that the mean work week has increased for women at the 5% level? Solve the following problems using the steps in conducting hypothesis tests.arrow_forward
arrow_back_ios
arrow_forward_ios
Recommended textbooks for you
- MATLAB: An Introduction with ApplicationsStatisticsISBN:9781119256830Author:Amos GilatPublisher:John Wiley & Sons Inc
 Probability and Statistics for Engineering and th...StatisticsISBN:9781305251809Author:Jay L. DevorePublisher:Cengage Learning
 Statistics for The Behavioral Sciences (MindTap C...StatisticsISBN:9781305504912Author:Frederick J Gravetter, Larry B. WallnauPublisher:Cengage Learning
  Elementary Statistics: Picturing the World (7th E...StatisticsISBN:9780134683416Author:Ron Larson, Betsy FarberPublisher:PEARSON
 The Basic Practice of StatisticsStatisticsISBN:9781319042578Author:David S. Moore, William I. Notz, Michael A. FlignerPublisher:W. H. Freeman
 Introduction to the Practice of StatisticsStatisticsISBN:9781319013387Author:David S. Moore, George P. McCabe, Bruce A. CraigPublisher:W. H. Freeman
MATLAB: An Introduction with Applications
Statistics
ISBN:9781119256830
Author:Amos Gilat
Publisher:John Wiley & Sons Inc
Probability and Statistics for Engineering and th...
Statistics
ISBN:9781305251809
Author:Jay L. Devore
Publisher:Cengage Learning
Statistics for The Behavioral Sciences (MindTap C...
Statistics
ISBN:9781305504912
Author:Frederick J Gravetter, Larry B. Wallnau
Publisher:Cengage Learning
Elementary Statistics: Picturing the World (7th E...
Statistics
ISBN:9780134683416
Author:Ron Larson, Betsy Farber
Publisher:PEARSON
The Basic Practice of Statistics
Statistics
ISBN:9781319042578
Author:David S. Moore, William I. Notz, Michael A. Fligner
Publisher:W. H. Freeman
Introduction to the Practice of Statistics
Statistics
ISBN:9781319013387
Author:David S. Moore, George P. McCabe, Bruce A. Craig
Publisher:W. H. Freeman