
MATLAB: An Introduction with Applications
6th Edition
ISBN: 9781119256830
Author: Amos Gilat
Publisher: John Wiley & Sons Inc
expand_more
expand_more
format_list_bulleted
Related questions
Question
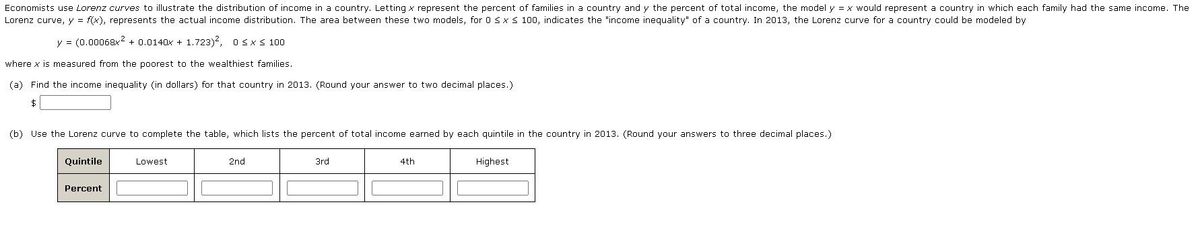

Transcribed Image Text:Economists use Lorenz curves to illustrate the distribution of income in a country. Letting x represent the percent of families in a country and y the percent of total income, the model y = x would represent a country in which each family had the same income. The
Lorenz curve, y = f(x), represents the actual income distribution. The area between these two models, for 0 sxs 100, indicates the "income inequality" of a country. In 2013, the Lorenz curve for a country could be modeled by
y = (0.00068x2 + 0.0140x + 1.723)2, OSx S 100
where x is measured from the poorest to the wealthiest families.
(a) Find the income inequality (in dollars) for that country in 2013. (Round your answer to two decimal places.)
(b) Use the Lorenz curve to complete the table, which lists the percent of total income earned by each quintile in the country in 2013. (Round your answers to three decimal places.)
Quintile
Lowest
2nd
3rd
4th
Highest
Percent
Expert Solution
This question has been solved!
Explore an expertly crafted, step-by-step solution for a thorough understanding of key concepts.

This is a popular solution

Trending nowThis is a popular solution!

Step by stepSolved in 2 steps with 2 images

Knowledge Booster

Similar questions
- In linear analysis, what is meant by the "best fitting" or "least squares" line? Choices: A: of all possible lines, the line with the steepest slope B. The line that minimizes the differences between the actual values of y and the predicted values of y C. of all possible lines, the line with the flattest slope D. the line that minimizes the differences between actual values of y and the mean value of yarrow_forwardThe following table shows the average yearly tuition and required fees, in dollars, charged by four-year American private universities in the school year beginning in the given year. Date Average tuition 2012 $27,870 2013 $29,004 2014 $30,138 2015 $31,272 2016 $32,406 (a) Show that these data can be modeled by a linear function. For each change of 1 year in time there is an increase of $ in tuition. Find its formula. (Let d be the date in terms of number of years since 2012 and T tuition in dollars.) T(d) = 27,870+1134d (b) Plot the data points and add the graph of the linear formula you found in part (a). (c) What prediction does this formula give for average tuition and fees at four-year American private universities for the academic year ending in 2018?$arrow_forwardPa.n.narrow_forward
- The table below shows the number of state-registered automatic weapons and the murder rate for several Northwestern states. x 11.4 8 6.8 3.4 2.4 2.2 2.4 0.4 y 13.5 10.7 10.1 6.9 5.9 5.6 6.3 4.2 x = thousands of automatic weapons y = murders per 100,000 residents This data can be modeled by the equation y = 0.85x + 3.97. Use this equation to answer the following; Special Note: I suggest you verify this equation by performing linear regression on your calculator. A) How many murders per 100,000 residents can be expected in a state with 10.3 thousand automatic weapons? Round to 3 decimal places. B) How many murders per 100,000 residents can be expected in a state with 4.3 thousand automatic weapons? Answer= Answer = Round to 3 decimal places.arrow_forwardThe number of banks in a country has been dropping steadily since 1984, and the trend in recent years has been roughly linear. The annual data for the years 1999 through 2008 can be summarized as follows, where x represents the years since 1990 and y the number of banks, in thousands. n=10 Ex-235 ²-5605 Ey-77.564 Ey²=603.80424 Exy-1810.155 a. Find an equation for the least squares line. b. Use your result from part a to predict the number of banks in the year 2020. c. If this trend continues linearly, in what year will the number of banks drop below 6200? d. Find and interpret the correlation coefficient.arrow_forwardThe table below shows the number of state-registered automatic weapons and the murder rate for several Northwestern states. x 11.9 8.4 6.6 3.8 2.6 2.3 2.2 0.9 y 14.2 11.1 9.6 7 6.2 6.1 5.8 5 x = thousands of automatic weaponsy = murders per 100,000 residentsThis data can be modeled by the equation y=0.85x+4.03. Use this equation to answer the following; Special Note: I suggest you verify this equation by performing linear regression on your calculator.A) How many murders per 100,000 residents can be expected in a state with 7.7 thousand automatic weapons?arrow_forward
- 9 students were surveyed to see what their age is and what their income level is. Find the equation of the line using linear regression. We want to predict their age using their income. age 18 24 38 22 19 35 28 19 27 income 456 786 835 855 645 244 587 1400 975 Just a side note, the 19 year old is making 1400, would be considered an outlier since they are making way more than everyone else. (y=-.0061x+34.9874 4 decimals) y=30.3709-.0064arrow_forwardI just need the d sectionarrow_forwardWhich of the following statements best describes linear regression? A measure of the degree of dependence between two variables. A statistical technique using pairs of data and identifying a line which ‘best fits’ all of the pairs of observations. A measure of the proportion of changes in the dependent variable which can be explained by a change in the independent variable. Shows individual costs against their associated activity levels but makes no attempt to identify a linear relationship between them.arrow_forward
arrow_back_ios
arrow_forward_ios
Recommended textbooks for you
- MATLAB: An Introduction with ApplicationsStatisticsISBN:9781119256830Author:Amos GilatPublisher:John Wiley & Sons Inc
 Probability and Statistics for Engineering and th...StatisticsISBN:9781305251809Author:Jay L. DevorePublisher:Cengage Learning
 Statistics for The Behavioral Sciences (MindTap C...StatisticsISBN:9781305504912Author:Frederick J Gravetter, Larry B. WallnauPublisher:Cengage Learning
  Elementary Statistics: Picturing the World (7th E...StatisticsISBN:9780134683416Author:Ron Larson, Betsy FarberPublisher:PEARSON
 The Basic Practice of StatisticsStatisticsISBN:9781319042578Author:David S. Moore, William I. Notz, Michael A. FlignerPublisher:W. H. Freeman
 Introduction to the Practice of StatisticsStatisticsISBN:9781319013387Author:David S. Moore, George P. McCabe, Bruce A. CraigPublisher:W. H. Freeman
MATLAB: An Introduction with Applications
Statistics
ISBN:9781119256830
Author:Amos Gilat
Publisher:John Wiley & Sons Inc
Probability and Statistics for Engineering and th...
Statistics
ISBN:9781305251809
Author:Jay L. Devore
Publisher:Cengage Learning
Statistics for The Behavioral Sciences (MindTap C...
Statistics
ISBN:9781305504912
Author:Frederick J Gravetter, Larry B. Wallnau
Publisher:Cengage Learning
Elementary Statistics: Picturing the World (7th E...
Statistics
ISBN:9780134683416
Author:Ron Larson, Betsy Farber
Publisher:PEARSON
The Basic Practice of Statistics
Statistics
ISBN:9781319042578
Author:David S. Moore, William I. Notz, Michael A. Fligner
Publisher:W. H. Freeman
Introduction to the Practice of Statistics
Statistics
ISBN:9781319013387
Author:David S. Moore, George P. McCabe, Bruce A. Craig
Publisher:W. H. Freeman