ENGR.ECONOMIC ANALYSIS
14th Edition
ISBN: 9780190931919
Author: NEWNAN
Publisher: Oxford University Press
expand_more
expand_more
format_list_bulleted
Question

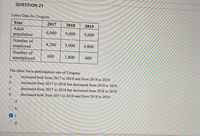
Transcribed Image Text:**Question 21: Labor Data for Uruguay**
| Year | Adult Population | Number of Employed | Number of Unemployed |
|------|-------------------|---------------------|-----------------------|
| 2017 | 6,000 | 4,200 | 600 |
| 2018 | 9,000 | 3,900 | 1,800 |
| 2019 | 9,600 | 4,800 | 600 |
**The labor force participation rate of Uruguay:**
a. increased both from 2017 to 2018 and from 2018 to 2019.
b. increased from 2017 to 2018 but decreased from 2018 to 2019.
c. decreased from 2017 to 2018 but increased from 2018 to 2019.
d. decreased both from 2017 to 2018 and from 2018 to 2019.
**Correct Answer:** c
- The labor force participation rate decreased from 2017 to 2018 but increased from 2018 to 2019.
**Explanation:** The table presents data on Uruguay's labor market from 2017 to 2019. The number of employed individuals initially decreased from 4,200 in 2017 to 3,900 in 2018, indicating a drop in labor force participation. However, this number rose to 4,800 in 2019, showing an increase in participation during that period. The number of unemployed individuals showed a different pattern, doubling from 600 in 2017 to 1,800 in 2018, before dropping back to 600 in 2019.

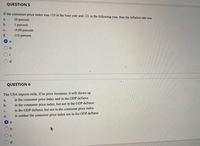
Transcribed Image Text:**Question 5**
If the consumer price index was 110 in the base year and 121 in the following year, then the inflation rate was:
a. 10 percent.
b. 1 percent.
c. -9.09 percent.
d. 110 percent.
- Selected answer: a
---
**Question 6**
The USA imports milk. If its price increases, it will show up:
a. in the consumer price index and in the GDP deflator.
b. in the consumer price index, but not in the GDP deflator.
c. in the GDP deflator, but not in the consumer price index.
d. in neither the consumer price index nor in the GDP deflator.
- Selected answer: a
Expert Solution
arrow_forward
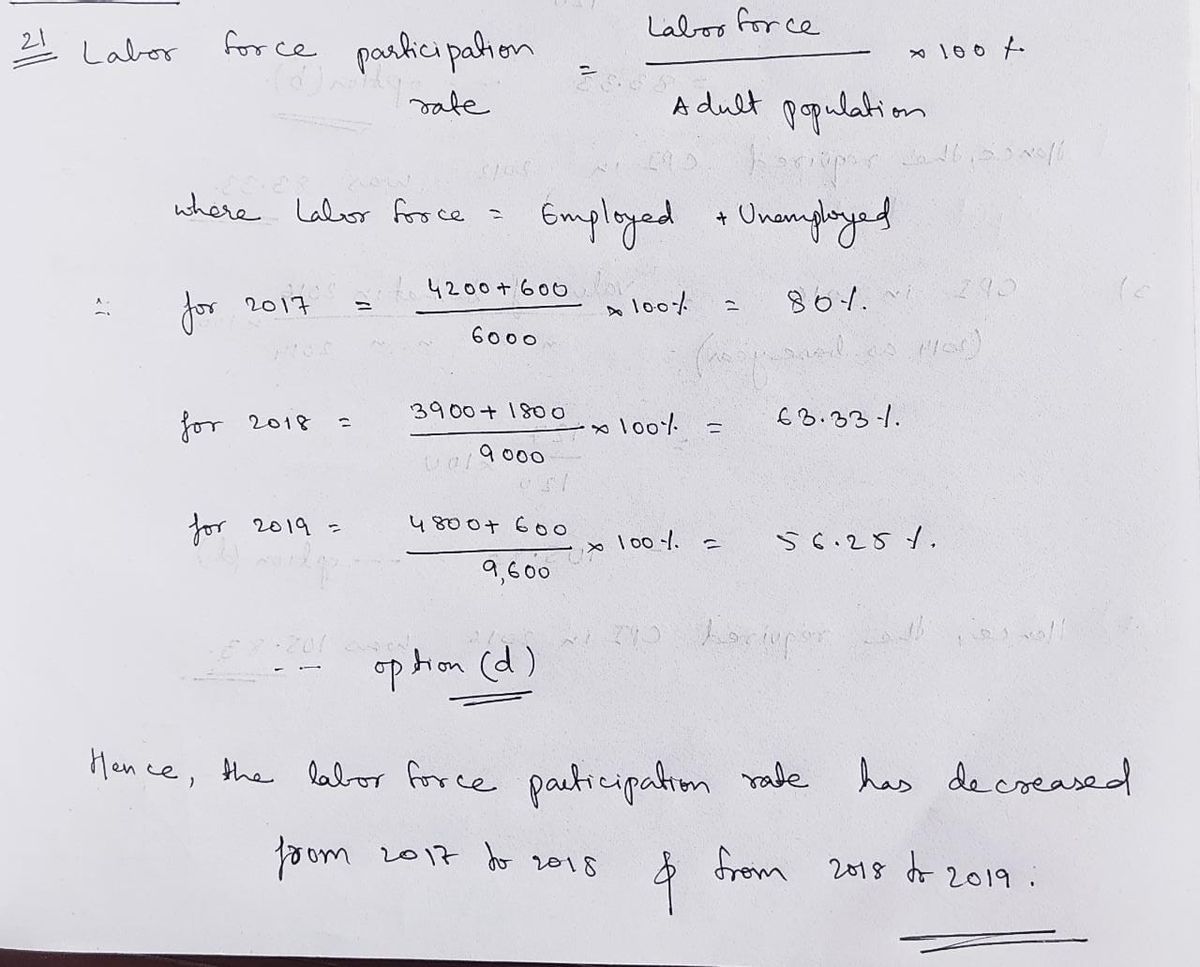
Step 1
CPI is measured using fixed basket of goods.
arrow_forward
Step 2

Step by stepSolved in 3 steps with 2 images

Knowledge Booster
Similar questions
- 7. 2019 2020 Price Quantity Price Quantity Rice $2.00 50 pounds $2.40 56 pounds Beans $.50 100 pounds $.90 89 pounds a. Assume that 2019 is the base year and calculate the consumer price index (CPI) for 2020. Show yourwork. b. The nominal wage was $28 in 2019, if it stayed the same in 2020, what is the real wage rate in 2020? c. Use the CPI to calculate the inflation rate for 2019? Show your work. d. What are the major flaws of using the CPI to measure inflation? List at least three.arrow_forwardIn 2000, the federal minimum hourly wage was $5.15. 2000 CPI=172.2 2016 CPI=240.0 (a) Find the inflation rate from 2000 to 2016 as measured by the CPI. (b) Complete the sentence: “If adjusted for inflation, the federal minimum hourly wage would increase from $5.15 to $_________________ in 2016.” Show how you got this. (c) The current federal minimum hourly wage is $7.25. As measured by the CPI, has the minimum wage kept up with inflation? Explain.arrow_forwardIn the year 2000, the CPI was 172.2 and the GDP deflator was 78.7. In 2019, the CPI had risen to 258.4 and the GDP deflator to 112.5. a. How much did prices increase from 2000 to 2019 according to the CPI and how much according to the GDP deflator? Why is there a difference? b. If the price of a 12oz can of Coke was $1.25 in 2000 and the price was $1.75 in 2019, did the real price of Coke go up, down, or stay the same? Explain your answer.arrow_forward
- Problem Solving Question: Answer the following questions 1. Use the following information to answer the next questions. A basket of: 3 Cakes and 4 Ice Cream. Year Price of Cake Price of Ice Cream Year 1 $10 $12 Year 2 12 15 Year 3 14 18 a. Compute the Cost of the Basket for each year. b. Using Year 1 as the base year, compute the consumer index (CPI) for each year. C. Compute the inflation rates for Year 2 and for Year 3.arrow_forwardProduct The GDP in China is $12.2 trillion. The rate of inflation is 2.5%. If the population of China is 1,421,021,000, find the per capita GDP in this country. per capita GDP = $ [?] Round to the nearest hundredth. Copyright © 2003-2022 International Academy of Science. All Rights Reserved. P in China is $12.2 trillion. The rate of mis 2.5%. If the population of China is 21,000, find the per capita GDP in this country. H t Enter a H M Darrow_forwardQUESTION 19 In an imaginary economy, consumers buy only sandwiches and hamburgers. The typical consumer consumes 10 sandwiches and 6 hamburgers. A sandwich cost $3 in 2020 and $5.40 in 2021. A hamburger cost $5 in 2020 and $6 in 2021. Which of the following statements is correct? When 2007 is chosen as the base year, the inflation rate is 50 percent in 2007 O When 2006 is chosen as the base year, the consumer price index is 90 in 2007. O When 2006 is chosen as the base year, the inflation rate is 150 percent in 2007. When 2006 is chosen as the base year, the inflation rate is 5 percent in 2007 When 2007 is chosen as the base year, the consumer price index is 100 in 2006. O Oarrow_forward
- Suppose your nominal income in dubai economic rose by 6.4 percent and the price level rose by 4.2 percent in some year Required: a. Calculate the percentage of real income (approximately) in dubai b. Assume that the nominal income rose by 4.1 percent and your real income rose by 2.7 percent in some year, Calculate the approximate rate of inflationarrow_forward3. In a small community, breakfast is the most important meal of the day. Therefore, the only two goods that this community produces are coffee and scones in the following amounts: Year 2020 2021 Quantity 60 cups 90 cups Coffee Price $1.25 $1.45 Quantity 45 units 65 units Scones Price $2.10 $3.95 a) Calculate the inflation rate for 2021 using the GDP deflator method (assume that 2020 is the base year for real GDP calculations). Show your work. b) Calculate the inflation rate for 2021 using the CPI method (assume that 2020 is the base year for CPI calculations). Additionally, assume that the consumption basket for both years contains only 10 cups of coffee and 40 scones. Show your work. c) Compare the results of both inflation calculations and explain why they are similar or different based on the two methods and on the specific data used in this example.arrow_forwardEcomomicsarrow_forward
- "Everyone is hurt by inflation." That statement is: A. Correct B. Incorrect because a price increase to one person is higher income to another C. Incorrect because people buy the same bundle of goods D. Incorrect because this statement concerns real income and not nominal incomearrow_forwardEconomics If the prices of German made cars imported into the United States Fall, which answer is correct? Provide justification please thanks A. the consumer price index will fall, but the GDP deflator will not fall B. both the GDP deflator and the consumer price index will fall c. neither the gdp deflator nor the CPI will fall d. the GDP deflator will fall but the consumer price index will not fall. d. the gdp deflator will fall but the consumer price index will not fall.arrow_forwardUse the information from the preceding table to fill in the following table. Year Nominal GDP Real GDP GDP Deflator 2018 410 410 100 2019 1170 585 200 2020 1080 480 225 From 2019 to 2020, nominal GDP (increase or decrease) , and real GDP (increase or decrease) . The inflation rate in 2020 was (-12.5%, 0.1%, 12.5%, 88.9%, 112.5%) .arrow_forward
arrow_back_ios
SEE MORE QUESTIONS
arrow_forward_ios
Recommended textbooks for you

 Principles of Economics (12th Edition)EconomicsISBN:9780134078779Author:Karl E. Case, Ray C. Fair, Sharon E. OsterPublisher:PEARSON
 Engineering Economy (17th Edition)EconomicsISBN:9780134870069Author:William G. Sullivan, Elin M. Wicks, C. Patrick KoellingPublisher:PEARSON
 Principles of Economics (MindTap Course List)EconomicsISBN:9781305585126Author:N. Gregory MankiwPublisher:Cengage Learning
 Managerial Economics: A Problem Solving ApproachEconomicsISBN:9781337106665Author:Luke M. Froeb, Brian T. McCann, Michael R. Ward, Mike ShorPublisher:Cengage Learning
 Managerial Economics & Business Strategy (Mcgraw-...EconomicsISBN:9781259290619Author:Michael Baye, Jeff PrincePublisher:McGraw-Hill Education


Principles of Economics (12th Edition)
Economics
ISBN:9780134078779
Author:Karl E. Case, Ray C. Fair, Sharon E. Oster
Publisher:PEARSON

Engineering Economy (17th Edition)
Economics
ISBN:9780134870069
Author:William G. Sullivan, Elin M. Wicks, C. Patrick Koelling
Publisher:PEARSON

Principles of Economics (MindTap Course List)
Economics
ISBN:9781305585126
Author:N. Gregory Mankiw
Publisher:Cengage Learning

Managerial Economics: A Problem Solving Approach
Economics
ISBN:9781337106665
Author:Luke M. Froeb, Brian T. McCann, Michael R. Ward, Mike Shor
Publisher:Cengage Learning

Managerial Economics & Business Strategy (Mcgraw-...
Economics
ISBN:9781259290619
Author:Michael Baye, Jeff Prince
Publisher:McGraw-Hill Education