ENGR.ECONOMIC ANALYSIS
14th Edition
ISBN: 9780190931919
Author: NEWNAN
Publisher: Oxford University Press
expand_more
expand_more
format_list_bulleted
Question
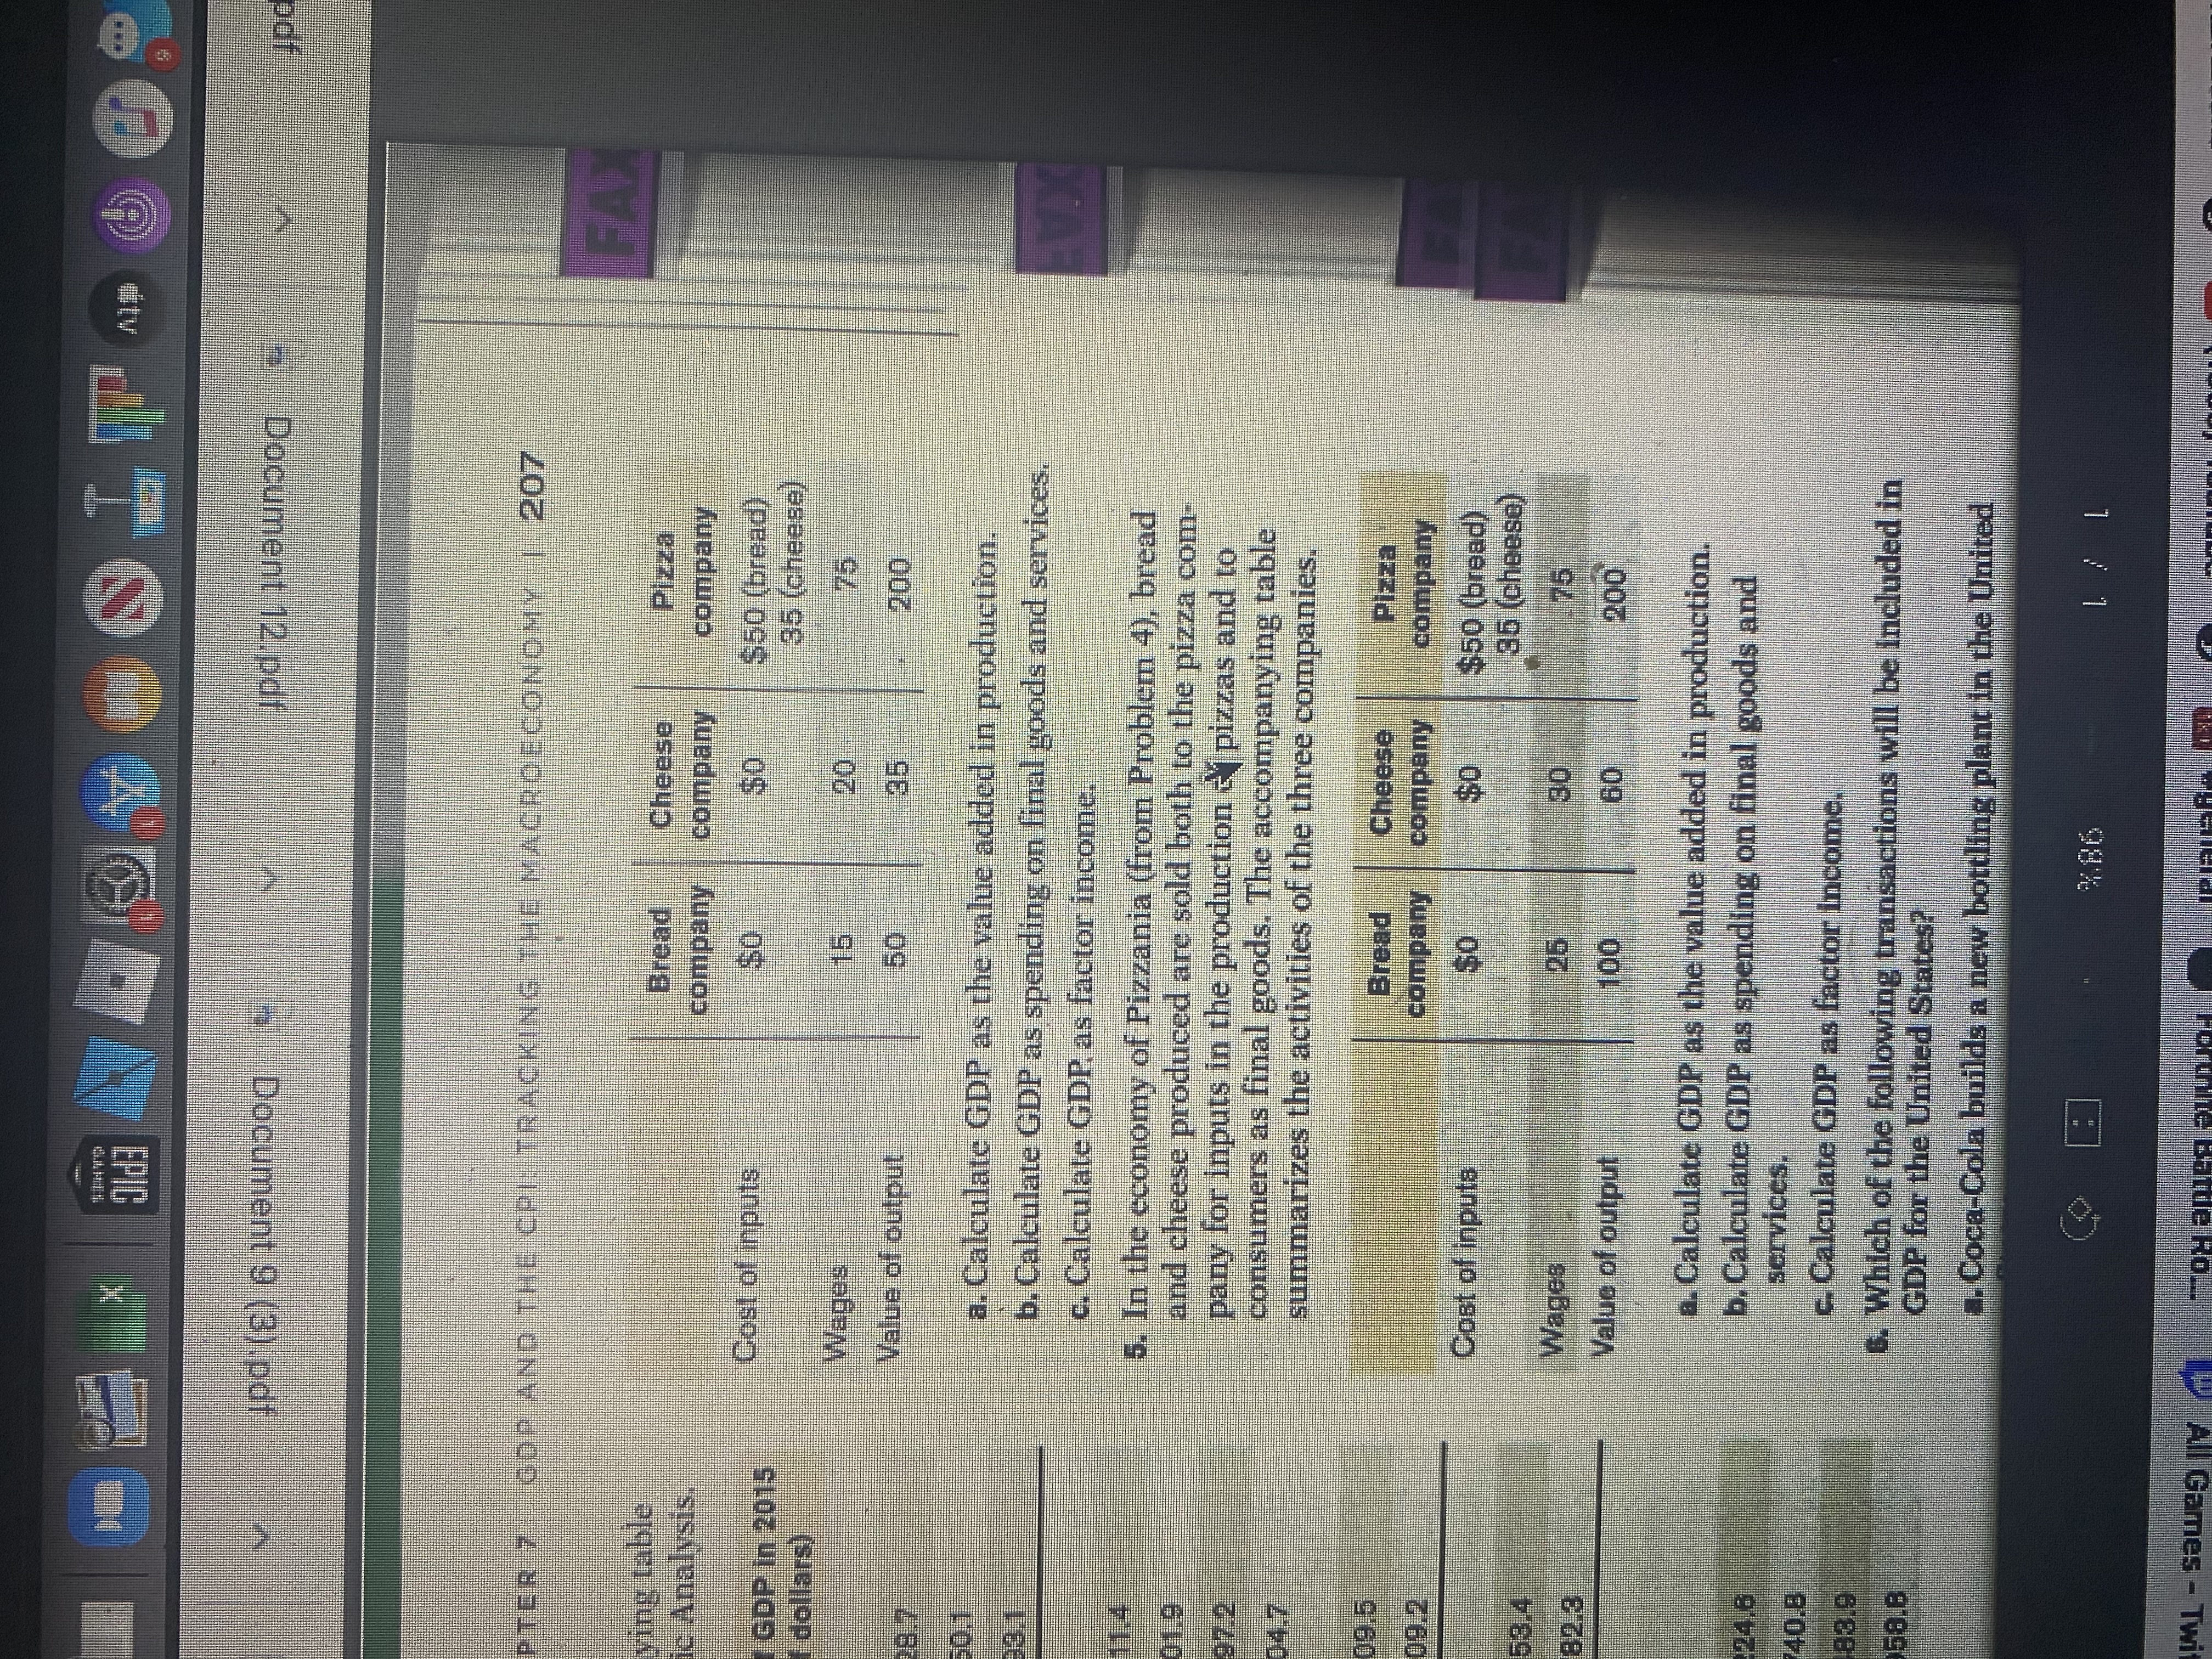
5.) In the economy of pizzania bread and cheese produced are sold both to the pizza company for inputs in the production of pizzas and to consumers as final goods. The accompanying table summarizes the activities of the three companies.
a. Calculate
b. Calculate GDP as spending on final goods and services.
c.Calculate GDP as factor income.

Expert Solution
This question has been solved!
Explore an expertly crafted, step-by-step solution for a thorough understanding of key concepts.
This is a popular solution
Trending nowThis is a popular solution!
Step by stepSolved in 2 steps

Knowledge Booster
Learn more about
Need a deep-dive on the concept behind this application? Look no further. Learn more about this topic, economics and related others by exploring similar questions and additional content below.Similar questions
- Using the following information. Show all working and calculate (i) the growth in nominal GDP and the growth in Real GDP (ii) did economic well being rise more in 2008 or 2009? Explainarrow_forwardC and Darrow_forward1. A simple economy produces three commodities: beer, cheese, and popcorn. The following data shows total production for this economy in 1999 and 2000: Beer Cheese Popcorn 1999 2000 1999 Quantity 200 300 100 1999 2000 Using 1999 as the base year, complete the following table for the economy: Nominal GDP (a) (b) Nominal GDP Real GDP 10,000 (1) (c) (d) 1999 Price $ 6.00 7.00 7.00 Real GDP (2) (3) GDP Price Index (e) (f) 2000 Quantity 200 300 100 Inflation Growth rate of rate nominal GDP 2. Complete the following table for a simple economy, assuming that 1999 is the base year: GDP Price (g) Index (4) (5) Inflation rate 2000 Price $7.00 9.00 9.00 --- (h) 5% Growth rate of real GDP Growth rate of nominal GDP (6) (i) Growth rate of real GDP 5%arrow_forward
- GDP 1. Calculate the values for the blanks in the shaded areas of the table below: Expenditure Components of GDP by Country, 2020 (83Son of current US dollars) Australia Canada Denmark Finland Japan India 1617 137.9 873 65.9 C E FOOD 80.0 65.3 16 0.5 L M N 195.4 97.G 1725 96.7 Household consumption Government expenditure Investments Gross fixed Investments Changes in inventories Net Exports Exports Imports A: ÄÜÄ÷ B: C: D: E: F: G: H: I: J: 746.5 K: L: 297.2 A 316.9 4.3 3152 254.7 943.7 371.8 B 377.7 (147) K 476.0 509.8 M: N: 0: P: 1,591.7 Q: R: 292.1 722.0 97.0 4973 $11.3 કીડી || T: 2.700.7 Y: 1,066.4 1,279.5 106 785.4 786.2 New Zealand UK 122.0 43.7 G 47.3 (p.s) P 46A GDP S U W Y Source: GOP by Type of Expenditure at current prices-US dollars, Retrieved 7/27/2022. National Accounts Estimates of Main Aggregates United Nations feste Division 472 Z: ZZ: 1,683.7 2. Based on the information in the table and your calculations for Question #1: Do any countries have positive net exports?…arrow_forwardIf the Citrus Growers Association grows $1 million worth of oranges, sells $500,000worth of oranges to consumers, uses the rest to make orange juice that is sold toconsumers for $3 million.a. What is the Citrus Growers Contribution to GDP ?b. What is the total GDP contribution of the entire production process?arrow_forwardThe table shows an economy’s total production of final goods and services. Compute nominal GDP. 1. The nominal GDP in 2010 is ___ and in 2011___arrow_forward
- 5. Problems and Applications Q9 A farmer grows wheat and sells to a miller for $90. The miller turns the wheat into flour and sells the flour to a baker for $145. The baker turns the wheat into bread and sells the bread to consumers for $155. Consumers eat the bread. Assume that these transactions account for all economic activity in this economy. GDP in this economy is S Value added is defined as the value of a producer's output minus the value of the intermediate goods that the producer buys to make the output. Assuming there are no intermediate goods beyond those just described, complete the following table by calculating the value added for each of the three producers. Then enter the total value added in the final row. Producer Farmer Miller Baker Total Value Added True or False: The total value added for the three producers in this economy equals the economy's GDP. True (Dollars) Falsearrow_forwardECON MCQ HOW DO I GO ABOUT THIS QUESTION? THANK YOU!arrow_forward
arrow_back_ios
arrow_forward_ios
Recommended textbooks for you

 Principles of Economics (12th Edition)EconomicsISBN:9780134078779Author:Karl E. Case, Ray C. Fair, Sharon E. OsterPublisher:PEARSON
 Engineering Economy (17th Edition)EconomicsISBN:9780134870069Author:William G. Sullivan, Elin M. Wicks, C. Patrick KoellingPublisher:PEARSON
 Principles of Economics (MindTap Course List)EconomicsISBN:9781305585126Author:N. Gregory MankiwPublisher:Cengage Learning
 Managerial Economics: A Problem Solving ApproachEconomicsISBN:9781337106665Author:Luke M. Froeb, Brian T. McCann, Michael R. Ward, Mike ShorPublisher:Cengage Learning
 Managerial Economics & Business Strategy (Mcgraw-...EconomicsISBN:9781259290619Author:Michael Baye, Jeff PrincePublisher:McGraw-Hill Education


Principles of Economics (12th Edition)
Economics
ISBN:9780134078779
Author:Karl E. Case, Ray C. Fair, Sharon E. Oster
Publisher:PEARSON

Engineering Economy (17th Edition)
Economics
ISBN:9780134870069
Author:William G. Sullivan, Elin M. Wicks, C. Patrick Koelling
Publisher:PEARSON

Principles of Economics (MindTap Course List)
Economics
ISBN:9781305585126
Author:N. Gregory Mankiw
Publisher:Cengage Learning

Managerial Economics: A Problem Solving Approach
Economics
ISBN:9781337106665
Author:Luke M. Froeb, Brian T. McCann, Michael R. Ward, Mike Shor
Publisher:Cengage Learning

Managerial Economics & Business Strategy (Mcgraw-...
Economics
ISBN:9781259290619
Author:Michael Baye, Jeff Prince
Publisher:McGraw-Hill Education