
ENGR.ECONOMIC ANALYSIS
14th Edition
ISBN: 9780190931919
Author: NEWNAN
Publisher: Oxford University Press
expand_more
expand_more
format_list_bulleted
Related questions
Concept explainers
Question
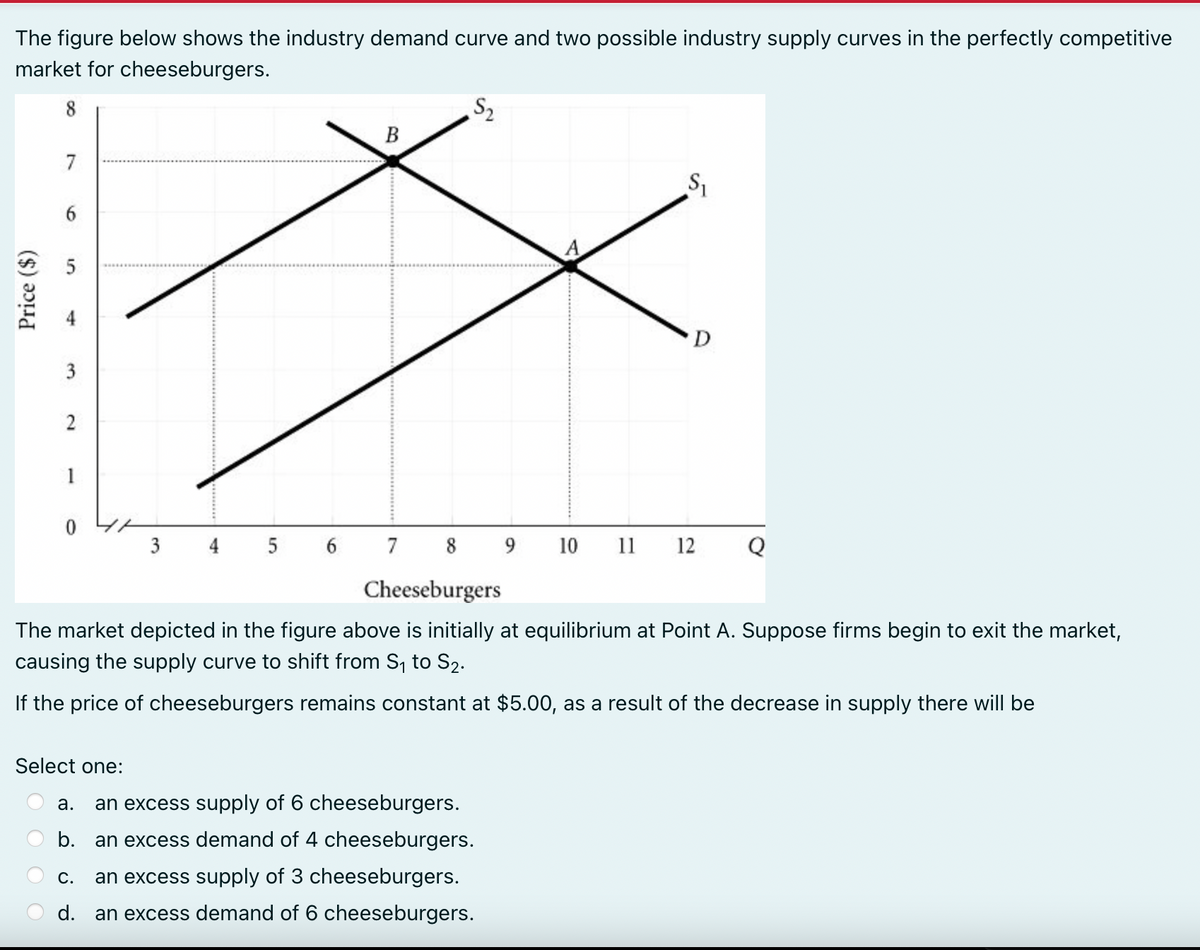

Transcribed Image Text:The figure below shows the industry demand curve and two possible industry supply curves in the perfectly competitive
market for cheeseburgers.
8
Price ($)
7
6
5
3
2
1
0
3
Select one:
B
4 5 6 7 8
S₂
9 10 11
a. an excess supply of 6 cheeseburgers.
b.
an excess demand of 4 cheeseburgers.
C. an excess supply of 3 cheeseburgers.
d. an excess demand of 6 cheeseburgers.
S₁
D
12
Cheeseburgers
The market depicted in the figure above is initially at equilibrium at Point A. Suppose firms begin to exit the market,
causing the supply curve to shift from S₁ to S₂.
If the price of cheeseburgers remains constant at $5.00, as a result of the decrease in supply there will be
Q
Expert Solution
This question has been solved!
Explore an expertly crafted, step-by-step solution for a thorough understanding of key concepts.

This is a popular solution

Trending nowThis is a popular solution!

Step by stepSolved in 2 steps

Knowledge Booster


Learn more about
Need a deep-dive on the concept behind this application? Look no further. Learn more about this topic, economics and related others by exploring similar questions and additional content below.Similar questions
- Mario's Pizza is the only pizza place in Sorrento City. The graph shows the market demand curve for pizza in Sorrento City. Mario's Pizza is a perfect price discriminator. What is the marginal revenue from the 20th pizza sold in an hour? The marginal revenue from the 20th pizza sold in an hour is O A. $300 O B. - $4 O C. $16 O D. $15 40- 35- 30- 25- 20- 15- 10- 5- 0+ -0 Price (dollars per pizza) -10 5 10 15 20 25 30 Quantity (pizzas per hour) D 35 40 -Sarrow_forwardSuppose postal service of pakistan is facing increased competition from firms providing overnight delivery of packages.what will be the effect of this competition on market for mail delivered by post officearrow_forward10. Figure 5 shows the graph of the short-run cost curves for Tim-T-Shirts, a firm operating in a perfectly competitive market. P* denotes the current price for Tim T-Shirts. Based on the information in the graph, which of the following should we expect in the long run? a) New firms will enter the market. b) The number of firms in the market will remain unchanged. c) Gray Sweaters will increase the current price of sweaters. d) There is not enough information to answer the question. Figure 5 Price and Costs P* MC ATC AVC Quantityarrow_forward
- 2. The demand curve facing a competitive firm The following graph illustrates the market for small moving trucks in Waco, TX, during Baylor's fall move-in week. PRICE (Dollars per small truck) 100 90 80 70 60 50 8 40 30 20 10 0 0 0 Demand 1 1 2 3 2 3 5 6 7 QUANTITY (Hundreds of small trucks) Suppose that You Yeet is one of over a dozen competitive firms in the Waco area that offers moving truck rentals. Based on the preceding graph showing the weekly market demand and supply curves, the price YouYeet must take as given is $ Fill in the price and the total, marginal, and average revenue YouYeet earns when it rents 0, 1, 2, or 3 trucks during move-in week. Quantity Price Total Revenue Marginal Revenue Average Revenue (Dollars) (Dollars) (Dollars per truck) (Trucks) (Dollars per truck) Supply curve Supply 9 Average revenue curve Marginal cost curve 10 0 Marginal revenue curve The demand curve faced by YouYeet is identical to which of its other curves? Check all that apply.arrow_forwardThe figures below show (on the left) two possible demand curves and (on the right) two possible supply curves in the perfectly competitive hamburger market. Price per hamburger 0 A B D₂ D₁ Hamburgers per month Price per hamburger 0 Select one: a. Movement along D₁ from Point A to Point B. b. Demand shifts from D₁ to D₂. F c. Movement along S₁ from Point F to Point G. d. Demand shifts from D₂ to D₁. G Hamburgers per month Assume that people consume either hamburgers or hot dogs. What will be the result of a decrease in the price of hot dogs? Hint: Are hamburgers and hotdogs complements or substitutes? S₂ S₁arrow_forward4arrow_forward
- 7. Notepads and pens can be considered to be complements. Woodchips are an input to notepads, and plastic is an input to pens. Assume markets for notepads, pens, woodchips and plastic, are all perfectly competitive. Suppose that the equilibrium price of notepads increases, and the equilibrium price of pens decrease. Which of the following could explain these changes? a) A decrease in the supply of plastic b) An increase in the demand for wood chips c) An increase in the demand for plastic d) An increase in the supply of plastic e) Either (b) or (d)arrow_forwardYou are given this demand schedule for new boats. Which of the following demand curves accurately represents the demand schedule and has proper formatting? The demand schedule for new boats Price ($) Quantity Demanded $500 5500 $1000 5000 $1500 4500 $2000 3500 $2500 3000 $3000 2000 $3500 1000 $4000 150 O 3100 10 NEW 3000 1000 THE None of the demand curves accurately represent the data in the schedule 9000 1000 3000 2000 . 1000 New Boats 1000 4000 New Boats Demanded New Boats 200 6000 7000arrow_forward2. The demand curve facing a competitive firm The following graph illustrates the market for small moving trucks in Flagstaff, AZ, during Northern Arizona's fall move-in week. PRICE (Dollars per small trick) 100 90 70 8 8 8 8 8 8 8 0 0 Demand 1 2 0 1 2 3 QUANTITY (Hundreds of small trucks) Supply Suppose that Zoom be is one of over a dozen competitive firms in the Flagstaff area that offers moving truck rentals. Based on the preceding graph showing the weekly market demand and supply curves, the price Zoomba must take as given is 9 Fill in the price and the total, marginal, and average revenue Zoomba earns when it rents 0, 1, 2, or 3 trucks during move-in week. Quantity Price (Trucks) (Dollars per truck) Total Revenue Marginal Revenue (Dollars) (Dollars) Average Revenue (Dollars per truck) 10 O Marginal revenue curve O Supply curve O Marginal cost curve Ⓒ Average revenue curve 0 The demand curve faced by Zoomba is identical to which of its other curves? Check all that apply. $10arrow_forward
- A) What is the profit-maximizing price? B) What is the profit-maximizing quantity? C) What is total revenue at the profit-maximizing quantity?arrow_forward22. Suppose the firm in the figure below sets a uniform price for its product. Please show the steps. a. If the firm chooses to set a uniform price for its product, then the profit-maximizing price is $________ and ________ units will be sold. Under this uniform pricing policy, the maximum possible profit is $________. b. The maximum profit the firm could earn if the firm sells 2,000 units and is able to charge the demand price for every one of the 2,000 units it sells is $ ________. c. For the additional number of units sold by expanding output to 2,000 units (from the output level in part a), the consumer surplus that could be captured if it were possible to charge the demand price on every one of those units would amount to $________.arrow_forwardFigure 12-6 Price (dollars per pound) Market 3 price 2 0 10 20 30 MC ATC D=MR 40 Quantity (thousands of pounds) Figure 12-6 shows the demand, marginal cost (MC) and average total cost (ATC) curves for Jason's House of Apples. Refer to Figure 12-6. Jason is currently producing 20 thousand pounds of apples. To maximize his profit Jason should keep production at 20 thousand pounds. O increase production to the output rate indicated by point e. increase production to the output rate indicated by point d. O decrease production to the output rate indicated by point a.arrow_forward
arrow_back_ios
SEE MORE QUESTIONS
arrow_forward_ios
Recommended textbooks for you
 Principles of Economics (12th Edition)EconomicsISBN:9780134078779Author:Karl E. Case, Ray C. Fair, Sharon E. OsterPublisher:PEARSON
 Engineering Economy (17th Edition)EconomicsISBN:9780134870069Author:William G. Sullivan, Elin M. Wicks, C. Patrick KoellingPublisher:PEARSON
 Principles of Economics (MindTap Course List)EconomicsISBN:9781305585126Author:N. Gregory MankiwPublisher:Cengage Learning
 Managerial Economics: A Problem Solving ApproachEconomicsISBN:9781337106665Author:Luke M. Froeb, Brian T. McCann, Michael R. Ward, Mike ShorPublisher:Cengage Learning
 Managerial Economics & Business Strategy (Mcgraw-...EconomicsISBN:9781259290619Author:Michael Baye, Jeff PrincePublisher:McGraw-Hill Education
Principles of Economics (12th Edition)
Economics
ISBN:9780134078779
Author:Karl E. Case, Ray C. Fair, Sharon E. Oster
Publisher:PEARSON
Engineering Economy (17th Edition)
Economics
ISBN:9780134870069
Author:William G. Sullivan, Elin M. Wicks, C. Patrick Koelling
Publisher:PEARSON
Principles of Economics (MindTap Course List)
Economics
ISBN:9781305585126
Author:N. Gregory Mankiw
Publisher:Cengage Learning
Managerial Economics: A Problem Solving Approach
Economics
ISBN:9781337106665
Author:Luke M. Froeb, Brian T. McCann, Michael R. Ward, Mike Shor
Publisher:Cengage Learning
Managerial Economics & Business Strategy (Mcgraw-...
Economics
ISBN:9781259290619
Author:Michael Baye, Jeff Prince
Publisher:McGraw-Hill Education