Principles of Economics 2e
2nd Edition
ISBN: 9781947172364
Author: Steven A. Greenlaw; David Shapiro
Publisher: OpenStax
expand_more
expand_more
format_list_bulleted
Question

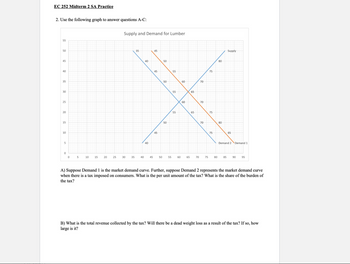
Transcribed Image Text:EC 252 Midterm 2 SA Practice
2. Use the following graph to answer questions A-C:
Supply and Demand for Lumber
55
50
45
40
35
30
25
20
15
10
5
35
45
40
50
40
45
55
45
50
60
70
50
55
65
60
70
75
55
65
75
80
70
80
Supply
75
85
Demand 2 Demand 1
0
0
5
10
15
20
25
30
35
40
45
50
55
60
65
70
75
80
85
90
95
A) Suppose Demand 1 is the market demand curve. Further, suppose Demand 2 represents the market demand curve
when there is a tax imposed on consumers. What is the per unit amount of the tax? What is the share of the burden of
the tax?
B) What is the total revenue collected by the tax? Will there be a dead weight loss as a result of the tax? If so, how
large is it?
Expert Solution
This question has been solved!
Explore an expertly crafted, step-by-step solution for a thorough understanding of key concepts.
This is a popular solution
Trending nowThis is a popular solution!
Step by stepSolved in 2 steps with 1 images

Knowledge Booster
Similar questions
- Suppose the price elasticity of demand for heating oil is 02. in the short run and 0.7 in the long run. a.If the price of heating oil rises from 1.80 to 2.20 per gallon, what happens to the quantity of heating oil demanded in the short run? In the long run? (Use the midpoint method in your calculations.) b.Why might this elasticity depend on the time horizon?arrow_forwardHow does one analyze a market where both demand and supply shift?arrow_forwardWhat is the difference between the demand and the quantity demanded of a product, say milk? Explain in words and show the difference on a graph with a demand curve for milk.arrow_forward
- Name some factors that can cause a shift in line demand curve in markets for goods and services.arrow_forwardWhat is the price elasticity of demand? Can you explain it in your own words?arrow_forwardSuppose you could buy shoes one at a time, miter than in pain. What do you predict the cross-price elasticity for left shoes and right shoes would be?arrow_forward
- What is the price elasticity of supply? Can you explain it in your own words?arrow_forwardSuppose the cross-price elasticity of apples with respect to the price of oranges is 0.4, and the price of oranges falls by 3. What will happen to the demand for apples?arrow_forwardWhat term would an economist use to describe what happens when a shopper gets in good deal on a product?arrow_forward
- Table 3.9 illustrates the markets demand and supply for cheddar cheese. Graph the data and find the equilibrium. Next, create a table showing the change in quantity demanded or quantity supplied, and a graph of the new equilibrium, in each of the following situations: The price of milk, a key input for cheese production, rises, so that the supply decreases by 80 pounds at every price. A new study says that eating cheese is good for your health, so that demand increases by 20 at every price.arrow_forwardWhat does a downward-sloping demand curve mean about how buyers in a market will react to a higher price?arrow_forwardConsider the demand for hamburgers. If the price of a substitute good (for example, hot dogs) increases and the price of a complement good (for example, hamburger buns) increases, can you tell for sure what will happen to the demand for hamburger? Why or why not? Illustrate your answer with a graph.arrow_forward
arrow_back_ios
SEE MORE QUESTIONS
arrow_forward_ios
Recommended textbooks for you
 Principles of Economics 2eEconomicsISBN:9781947172364Author:Steven A. Greenlaw; David ShapiroPublisher:OpenStax
 Essentials of Economics (MindTap Course List)EconomicsISBN:9781337091992Author:N. Gregory MankiwPublisher:Cengage Learning
 Principles of Economics (MindTap Course List)EconomicsISBN:9781305585126Author:N. Gregory MankiwPublisher:Cengage Learning
 Principles of Microeconomics (MindTap Course List)EconomicsISBN:9781305971493Author:N. Gregory MankiwPublisher:Cengage Learning
 Principles of Economics, 7th Edition (MindTap Cou...EconomicsISBN:9781285165875Author:N. Gregory MankiwPublisher:Cengage Learning
 Principles of MicroeconomicsEconomicsISBN:9781305156050Author:N. Gregory MankiwPublisher:Cengage Learning

Principles of Economics 2e
Economics
ISBN:9781947172364
Author:Steven A. Greenlaw; David Shapiro
Publisher:OpenStax

Essentials of Economics (MindTap Course List)
Economics
ISBN:9781337091992
Author:N. Gregory Mankiw
Publisher:Cengage Learning

Principles of Economics (MindTap Course List)
Economics
ISBN:9781305585126
Author:N. Gregory Mankiw
Publisher:Cengage Learning

Principles of Microeconomics (MindTap Course List)
Economics
ISBN:9781305971493
Author:N. Gregory Mankiw
Publisher:Cengage Learning

Principles of Economics, 7th Edition (MindTap Cou...
Economics
ISBN:9781285165875
Author:N. Gregory Mankiw
Publisher:Cengage Learning

Principles of Microeconomics
Economics
ISBN:9781305156050
Author:N. Gregory Mankiw
Publisher:Cengage Learning