
MATLAB: An Introduction with Applications
6th Edition
ISBN: 9781119256830
Author: Amos Gilat
Publisher: John Wiley & Sons Inc
expand_more
expand_more
format_list_bulleted
Related questions
Question
Interpret results in the context of problem.
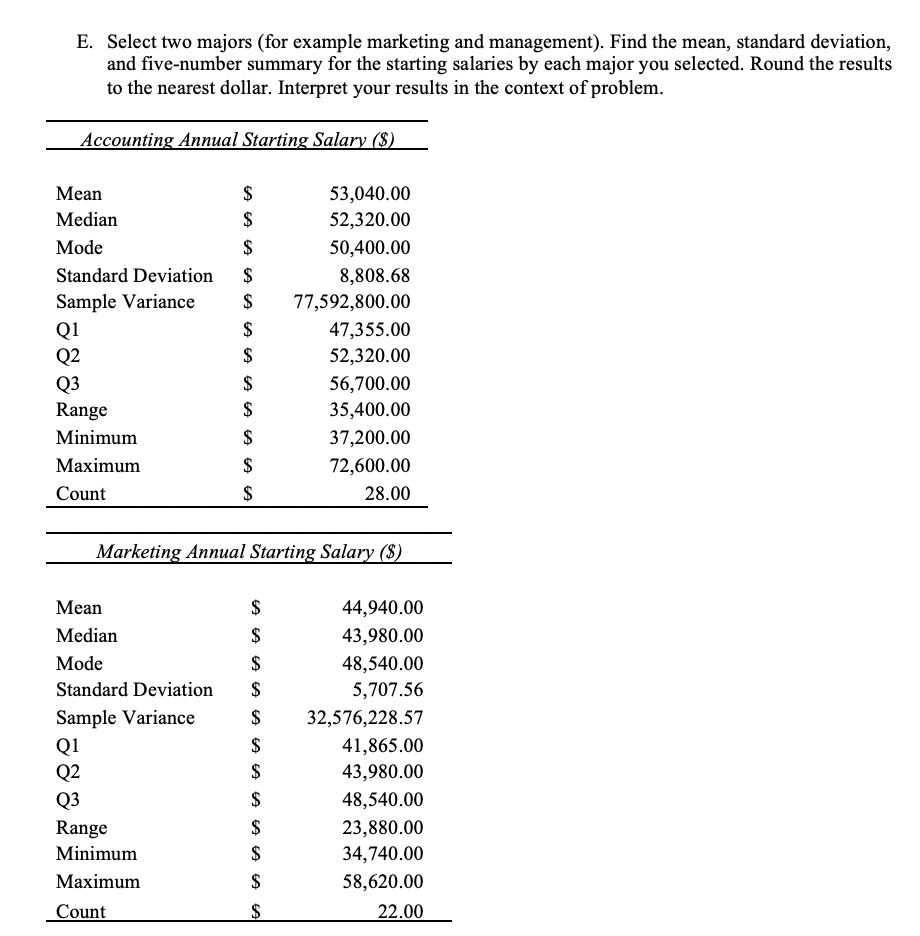

Transcribed Image Text:E. Select two majors (for example marketing and management). Find the mean, standard deviation,
and five-number summary for the starting salaries by each major you selected. Round the results
to the nearest dollar. Interpret your results in the context of problem.
Accounting Annual Starting Salary ($)
Mean
Median
Mode
$
$
$
Standard Deviation $
Sample Variance
Q1
Q2
Q3
Range
Minimum
Maximum
Count
$ 77,592,800.00
$
$
Q1
Q2
Q3
Range
Minimum
Maximum
Count
$
$
$
$
$
Mean
$
Median
$
Mode
$
Standard Deviation $
Sample Variance
$
$
$
$
$
Marketing Annual Starting Salary ($)
LA LA LA
53,040.00
52,320.00
50,400.00
8,808.68
$
$
$
47,355.00
52,320.00
56,700.00
35,400.00
37,200.00
72,600.00
28.00
44,940.00
43,980.00
48,540.00
5,707.56
32,576,228.57
41,865.00
43,980.00
48,540.00
23,880.00
34,740.00
58,620.00
22.00
Expert Solution
This question has been solved!
Explore an expertly crafted, step-by-step solution for a thorough understanding of key concepts.

This is a popular solution

Trending nowThis is a popular solution!

Step by stepSolved in 3 steps

Knowledge Booster

Similar questions
- ALREADY HAVE FIRST THREE ANSWERS NEED THE REST. ANOVA. Dr. Milgram is conducting a patient satisfaction survey, rating how well her patients like her on a scale of 1-10. Her patients tend to fall into three categories: “Like a lot”, “like somewhat”, and “dislike a lot”. She believes that she might get different satisfaction scores from people in each group, but (because she's not great at numbers) she wants you to do an ANOVA to be sure. She has collected data from 12 patients (three equal groups) with the following results. Group 1) “Like a lot” Mean: 8 SS: 2 N: df: Group 2) “Like somewhat” Mean: 5 SS: 6 N: df: Group 3) “Dislike a lot” Mean: 2 SS: 4 N: df: Grand Mean: 4 df Within-Group: 9 df Between-Groups: 2 Estimated Variance (S21) for Group 1: _______ Estimated Variance (S22)…arrow_forwardProblem 28. In a survey of 200 first-graders, 52% of them said that their favorite cartoon character is Sponge Bob Square Pants. The margin of error for the survey is +7.1%. Write a statement about the percentage of all first-graders whose favorite cartoon character is Sponge Bob Square Pants.arrow_forwardIn an area of the Great Plains, records were kept on the relationship between the rainfall (in inches) and the yield of wheat (bushels per acre). The table shows the number of inches of rainfall and the yield (in bushels per acre). Use for problem #17 and #18. Rainfall (in inches), x 9.8 8.1 12.7 11.8 18.1 9.6 6.3 14.9 15.3 Yield (bushels per acre), y 48.5 44.2 56.8 57 80.4 47.2 29.9 74 76.8 17. Compute the linear correlation coefficient between the two variables above. (Round to thousandths.) 18. Determine whether a linear relation exists. (Show work to justify answer.)arrow_forward
- need answer and all the workarrow_forwardThe per-unit amount of three different production costs for Thunderbird, Inc., are as follows: Cost A(per unit) Cost B(per unit) Cost C(per unit) Production = 16,000 $32 24 $19.20 Production = 64,000 $8 8.00 $19.20 What type of cost is each?arrow_forwardI HAVE THE GRAND MEAN ALREADY NEED REST OF THE PROBLEMS SOLVED. ANOVA. Dr. Milgram is conducting a patient satisfaction survey, rating how well her patients like her on a scale of 1-10. Her patients tend to fall into three categories: “Like a lot”, “like somewhat”, and “dislike a lot”. She believes that she might get different satisfaction scores from people in each group, but (because she's not great at numbers) she wants you to do an ANOVA to be sure. She has collected data from 12 patients (three equal groups) with the following results. Group 1) “Like a lot” Mean: 8 SS: 2 N: df: Group 2) “Like somewhat” Mean: 5 SS: 6 N: df: Group 3) “Dislike a lot” Mean: 2 SS: 4 N: df: Grand Mean: 4 df Within-Group:__________ df Between-Groups:___________ Estimated Variance (S21) for Group 1:…arrow_forward
arrow_back_ios
arrow_forward_ios
Recommended textbooks for you
- MATLAB: An Introduction with ApplicationsStatisticsISBN:9781119256830Author:Amos GilatPublisher:John Wiley & Sons Inc
 Probability and Statistics for Engineering and th...StatisticsISBN:9781305251809Author:Jay L. DevorePublisher:Cengage Learning
 Statistics for The Behavioral Sciences (MindTap C...StatisticsISBN:9781305504912Author:Frederick J Gravetter, Larry B. WallnauPublisher:Cengage Learning
  Elementary Statistics: Picturing the World (7th E...StatisticsISBN:9780134683416Author:Ron Larson, Betsy FarberPublisher:PEARSON
 The Basic Practice of StatisticsStatisticsISBN:9781319042578Author:David S. Moore, William I. Notz, Michael A. FlignerPublisher:W. H. Freeman
 Introduction to the Practice of StatisticsStatisticsISBN:9781319013387Author:David S. Moore, George P. McCabe, Bruce A. CraigPublisher:W. H. Freeman
MATLAB: An Introduction with Applications
Statistics
ISBN:9781119256830
Author:Amos Gilat
Publisher:John Wiley & Sons Inc
Probability and Statistics for Engineering and th...
Statistics
ISBN:9781305251809
Author:Jay L. Devore
Publisher:Cengage Learning
Statistics for The Behavioral Sciences (MindTap C...
Statistics
ISBN:9781305504912
Author:Frederick J Gravetter, Larry B. Wallnau
Publisher:Cengage Learning
Elementary Statistics: Picturing the World (7th E...
Statistics
ISBN:9780134683416
Author:Ron Larson, Betsy Farber
Publisher:PEARSON
The Basic Practice of Statistics
Statistics
ISBN:9781319042578
Author:David S. Moore, William I. Notz, Michael A. Fligner
Publisher:W. H. Freeman
Introduction to the Practice of Statistics
Statistics
ISBN:9781319013387
Author:David S. Moore, George P. McCabe, Bruce A. Craig
Publisher:W. H. Freeman