
MATLAB: An Introduction with Applications
6th Edition
ISBN: 9781119256830
Author: Amos Gilat
Publisher: John Wiley & Sons Inc
expand_more
expand_more
format_list_bulleted
Related questions
Concept explainers
Question
thumb_up100%
Hello, I need help with part e and f. I attached a photo of the data set and questions e and f. I calculated the sample mean in excel and got 60,143. For the sample standard deviation, I got 10,462.38.

Transcribed Image Text:Transcription of Image Content for an Educational Website:
---
### Data Analysis: Maximum Capacity of Sports Stadiums
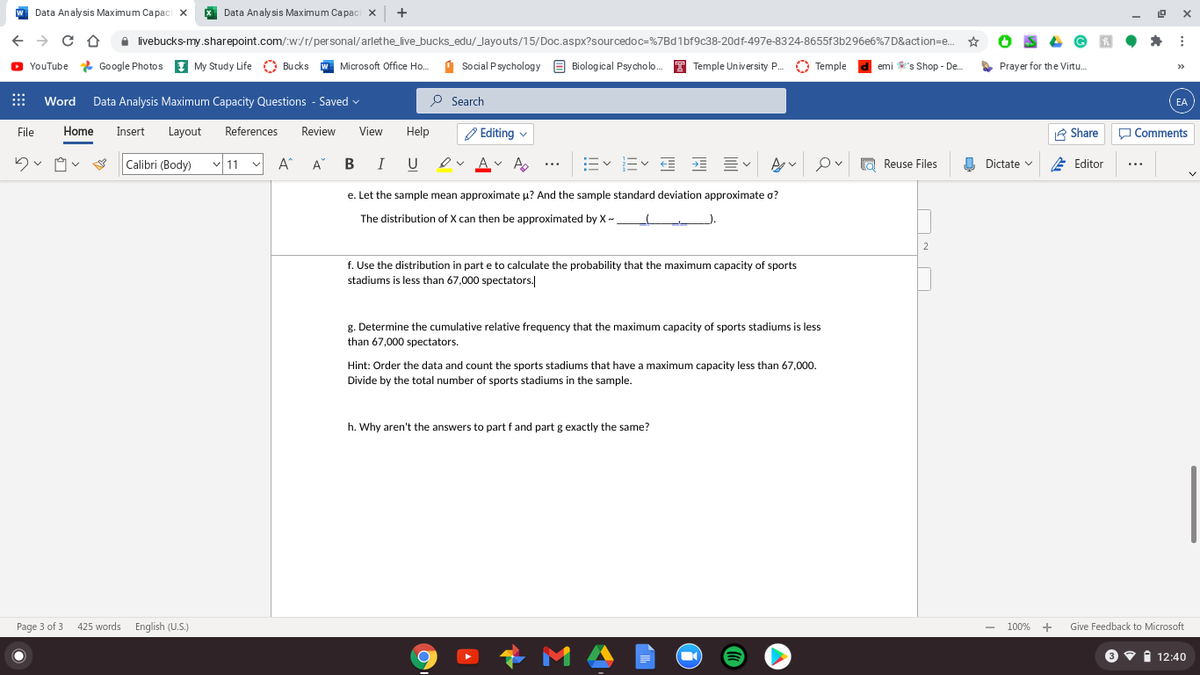
**e. Let the sample mean approximate μ and the sample standard deviation approximate σ.**
- The distribution of X can then be approximated by \( X \sim N(\mu, \sigma^2) \).
**f. Use the distribution in part e to calculate the probability that the maximum capacity of sports stadiums is less than 67,000 spectators.**
**g. Determine the cumulative relative frequency that the maximum capacity of sports stadiums is less than 67,000 spectators.**
- **Hint:** Order the data and count the sports stadiums that have a maximum capacity less than 67,000. Divide by the total number of sports stadiums in the sample.
**h. Why aren’t the answers to part f and part g exactly the same?**
---
Note: The document is a snippet from a lesson on statistical analysis, focusing on probabilities and cumulative frequencies related to stadium capacities. There are no graphs or diagrams present in the image.
![**Data Analysis: Maximum Capacity**
**Chapter 6 Assignment**
A sample of the maximum capacity of spectators of sports stadiums is included in the table:
| 40,000 | 40,000 | 45,050 | 45,500 | 46,249 | 48,134 |
|--------|--------|--------|--------|--------|--------|
| 49,133 | 50,071 | 50,906 | 50,466 | 50,832 | 51,500 |
| 51,500 | 51,900 | 52,000 | 52,132 | 52,000 | 52,530 |
| 52,692 | 53,864 | 54,000 | 55,000 | 55,000 | 55,000 |
| 55,000 | 55,000 | 55,000 | 55,000 | 55,000 | 58,008 |
| 59,860 | 60,000 | 60,492 | 60,580 | 62,380 | 62,872 |
| 64,035 | 65,000 | 66,647 | 66,000 | 66,161 | 67,428 |
| 68,349 | 68,976 | 69,372 | 70,107 | 70,585 | 71,594 |
| 72,922 | 73,379 | 74,500 | 75,025 | 76,212 | 78,000 |
| 78,000 | 80,000 | 80,000 | 80,000 | 82,300 | |
*The table does not include horse-racing or motor-racing stadiums.*
**a. Calculate the sample mean and the sample standard deviation for the maximum capacity of sports stadiums (see data above).**
**Sample Mean:**
\[
\bar{X} = \frac{\sum_{i=1}^{n} x_{i}}{n}
\]
\[ = \frac{75,339}{78} = 73,859 \]](https://content.bartleby.com/qna-images/question/5e4abf04-5494-4b59-8e86-398eb44a6ecc/cf8bb0cc-bfcc-40b4-a3ca-000639915a97/ik9oh9g_processed.png)
Transcribed Image Text:**Data Analysis: Maximum Capacity**
**Chapter 6 Assignment**
A sample of the maximum capacity of spectators of sports stadiums is included in the table:
| 40,000 | 40,000 | 45,050 | 45,500 | 46,249 | 48,134 |
|--------|--------|--------|--------|--------|--------|
| 49,133 | 50,071 | 50,906 | 50,466 | 50,832 | 51,500 |
| 51,500 | 51,900 | 52,000 | 52,132 | 52,000 | 52,530 |
| 52,692 | 53,864 | 54,000 | 55,000 | 55,000 | 55,000 |
| 55,000 | 55,000 | 55,000 | 55,000 | 55,000 | 58,008 |
| 59,860 | 60,000 | 60,492 | 60,580 | 62,380 | 62,872 |
| 64,035 | 65,000 | 66,647 | 66,000 | 66,161 | 67,428 |
| 68,349 | 68,976 | 69,372 | 70,107 | 70,585 | 71,594 |
| 72,922 | 73,379 | 74,500 | 75,025 | 76,212 | 78,000 |
| 78,000 | 80,000 | 80,000 | 80,000 | 82,300 | |
*The table does not include horse-racing or motor-racing stadiums.*
**a. Calculate the sample mean and the sample standard deviation for the maximum capacity of sports stadiums (see data above).**
**Sample Mean:**
\[
\bar{X} = \frac{\sum_{i=1}^{n} x_{i}}{n}
\]
\[ = \frac{75,339}{78} = 73,859 \]
Expert Solution
This question has been solved!
Explore an expertly crafted, step-by-step solution for a thorough understanding of key concepts.

This is a popular solution

Trending nowThis is a popular solution!

Step by stepSolved in 2 steps with 2 images

Knowledge Booster


Learn more about
Need a deep-dive on the concept behind this application? Look no further. Learn more about this topic, statistics and related others by exploring similar questions and additional content below.Similar questions
- According to the U.S. Census, the average adult woman is the United States is 65 inches tall and the standard deviation is 3 inches. If Zsike is 67 inches tall, what is her z-score?arrow_forwardFrom the states data set, get the descriptive statistics for the violent crime rate. For this assignment, you will need the mean, standard deviation, five-number summary (minimum, 25th percentile, median, 75th percentile, maximum), and interquartile range. Submit all answers as whole numbers--no decimal points. If you have to calculate the interquartile range by hand, you may calculate it using whole numbers as the 25th and 75 percentile. How would i calculate this?arrow_forwardFind the estimated standard error for the sample mean for n = 16 and SS= 3806. Round to the nearest hundredths.arrow_forward
- Name: ID: B 14. Is the sample mean, calculated from a random sample, an unbiased estimator of the population mean? Explain.arrow_forwardAn Excel assignment counts for 0-10 points. The scores in a class of 12 students are recorded as follows:1 5 5 6 7 7 8 8 8 9 10 10 What is the deviation of the score 10 from the mean in 13a (recall that this involves a subtraction of the mean from the particular score)? I think I got answer but want to check.arrow_forwardMario's weekly poker winnings have a mean of $353 and a standard deviation of $67. Last week he won $185. How many standard deviations from the mean is that?arrow_forward
- In Statsville there’s a city-wide speed limit of 30 mph.If you are caught speeding the fine is $100 plus $10 forevery mile per hour you were over the speed limit. Forexample, if you’re ticketed for going 45 mph, your fine is100 + 10145 - 302 = +250. Last month all the driverswho were fined for speeding averaged 42 mph with astandard deviation of 7 mph. What were the mean andstandard deviation of the fines?A) $120 and $70 B) $220 and $7C) $220 and $70 D) $220 and $170E) $420 and $70arrow_forwardFind the estimated standard error for the sample mean for n = 13 and SS = 3639. Nearest hundredths place.arrow_forwardThe tourist bureau of the Caribbean Island survey a sample of 6 United States tourists as they left to return home. The tourist was asked how many days they spent on their visits. Their responses were as follows: 11,8,6,12,10,7 find the standard deviation of this sample of numbers.arrow_forward
arrow_back_ios
arrow_forward_ios
Recommended textbooks for you
- MATLAB: An Introduction with ApplicationsStatisticsISBN:9781119256830Author:Amos GilatPublisher:John Wiley & Sons Inc
 Probability and Statistics for Engineering and th...StatisticsISBN:9781305251809Author:Jay L. DevorePublisher:Cengage Learning
 Statistics for The Behavioral Sciences (MindTap C...StatisticsISBN:9781305504912Author:Frederick J Gravetter, Larry B. WallnauPublisher:Cengage Learning
  Elementary Statistics: Picturing the World (7th E...StatisticsISBN:9780134683416Author:Ron Larson, Betsy FarberPublisher:PEARSON
 The Basic Practice of StatisticsStatisticsISBN:9781319042578Author:David S. Moore, William I. Notz, Michael A. FlignerPublisher:W. H. Freeman
 Introduction to the Practice of StatisticsStatisticsISBN:9781319013387Author:David S. Moore, George P. McCabe, Bruce A. CraigPublisher:W. H. Freeman
MATLAB: An Introduction with Applications
Statistics
ISBN:9781119256830
Author:Amos Gilat
Publisher:John Wiley & Sons Inc
Probability and Statistics for Engineering and th...
Statistics
ISBN:9781305251809
Author:Jay L. Devore
Publisher:Cengage Learning
Statistics for The Behavioral Sciences (MindTap C...
Statistics
ISBN:9781305504912
Author:Frederick J Gravetter, Larry B. Wallnau
Publisher:Cengage Learning
Elementary Statistics: Picturing the World (7th E...
Statistics
ISBN:9780134683416
Author:Ron Larson, Betsy Farber
Publisher:PEARSON
The Basic Practice of Statistics
Statistics
ISBN:9781319042578
Author:David S. Moore, William I. Notz, Michael A. Fligner
Publisher:W. H. Freeman
Introduction to the Practice of Statistics
Statistics
ISBN:9781319013387
Author:David S. Moore, George P. McCabe, Bruce A. Craig
Publisher:W. H. Freeman