
MATLAB: An Introduction with Applications
6th Edition
ISBN: 9781119256830
Author: Amos Gilat
Publisher: John Wiley & Sons Inc
expand_more
expand_more
format_list_bulleted
Related questions
Question
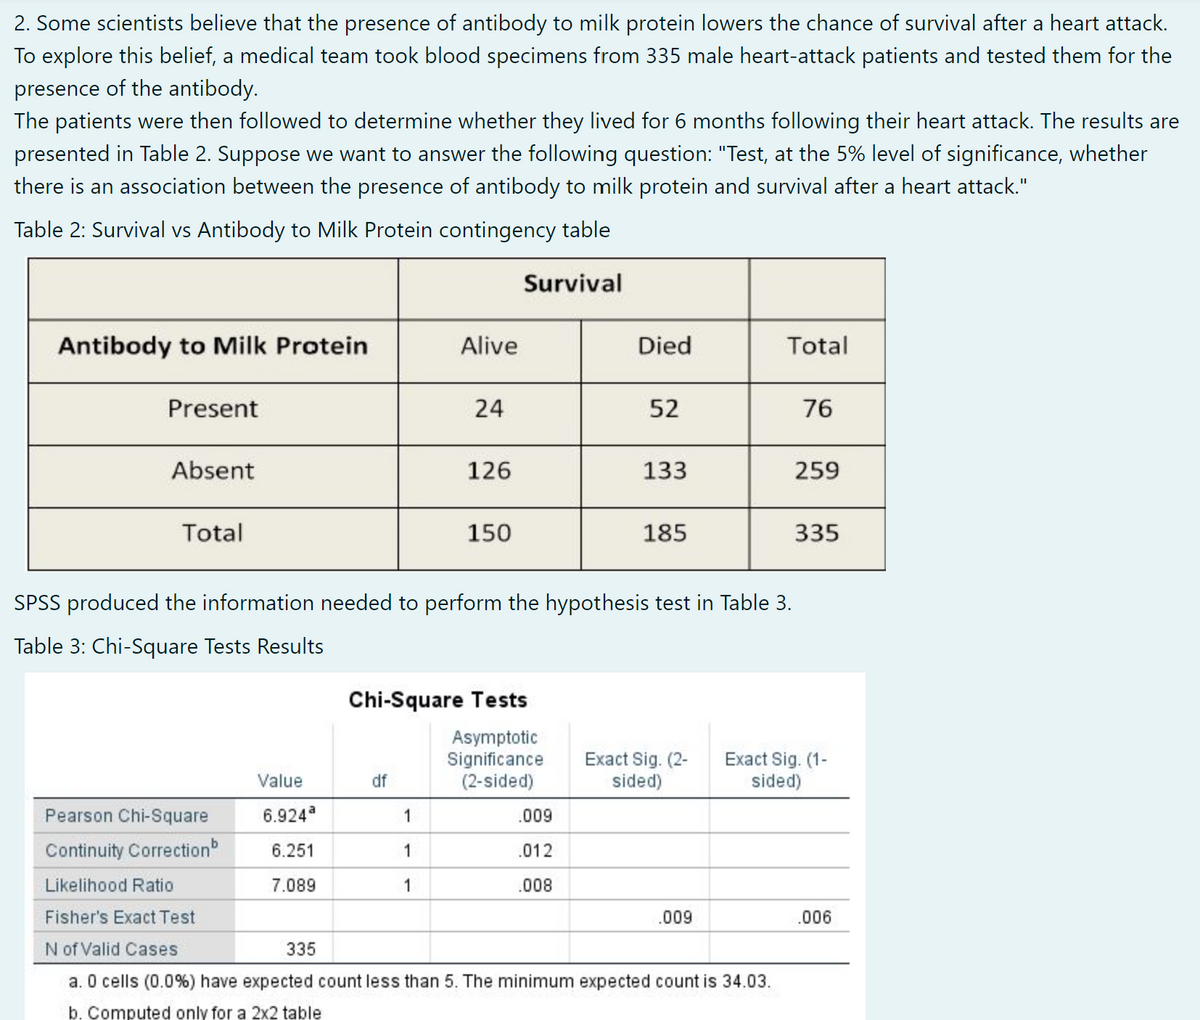

Transcribed Image Text:2. Some scientists believe that the presence of antibody to milk protein lowers the chance of survival after a heart attack.
To explore this belief, a medical team took blood specimens from 335 male heart-attack patients and tested them for the
presence of the antibody.
The patients were then followed to determine whether they lived for 6 months following their heart attack. The results are
presented in Table 2. Suppose we want to answer the following question: "Test, at the 5% level of significance, whether
there is an association between the presence of antibody to milk protein and survival after a heart attack."
Table 2: Survival vs Antibody to Milk Protein contingency table
Survival
Antibody to Milk Protein
Alive
Died
Total
Present
24
52
76
Absent
126
133
259
Total
150
185
335
SPSS produced the information needed to perform the hypothesis test in Table 3.
Table 3: Chi-Square Tests Results
Chi-Square Tests
Asymptotic
Significance
(2-sided)
Exact Sig. (2-
sided)
Exact Sig. (1-
sided)
Value
df
Pearson Chi-Square
6.924
1
.009
Continuity Correction
6.251
.012
Likelihood Ratio
7.089
.008
Fisher's Exact Test
.009
.006
N of Valid Cases
335
a. O cells (0.0%) have expected count less than 5. The minimum expected count is 34.03.
b. Computed only for a 2x2 table

Transcribed Image Text:e. Is the requirement that the expected frequency in each cell is 5 or greater satisfied? Explain.
Statement a.,
under the Chi-Square Test table, states that there are no expected frequencies less than 5. So the
requirement that the expected frequency in each cell is 5 or greater is satisfied.
O Statement b., under the Chi-Square Test table, states that the continuity correction is computed only for a 2X2 table.
So the requirement that the expected frequency in each cell is 5 or greater is not satisfied.
Statement a., under the Chi-Square Test table, states that there are no expected frequencies less than 5. So the
requirement that the expected frequency in each cell is 5 or greater is not satisfied.
Statement b., under the Chi-Square Test table, states that the continuity correction is computed only for a 2X2 table.
So the requirement that the expected frequency in each cell is 5 or greater is satisfied.
Expert Solution
This question has been solved!
Explore an expertly crafted, step-by-step solution for a thorough understanding of key concepts.

Step by stepSolved in 2 steps

Knowledge Booster

Similar questions
- Assume that the sample is a simple random sample obtained from a normally distributed population of IQ scores of statistics professors. Use the table below to find the minimum sample size needed to be 99% confident that the sample standard deviation s is within 40% of sigma. The minimum sample size needed is?arrow_forward40a 40 - It is claimed that the daily number of New Covid19 cases in a province is more than 250. To test the claim, the 10-day case numbers were examined and the following results were found. Number of cases 200 210 220 230 235 243 245 252 255 260 find the mean a) 240 B) 250 NS) 230 D) 235 TO) 245arrow_forward1.) A survey of 80 random Americans showed that 5 are naturally blonde.A Google search says that 5% of Americans are blonde. At x=0.05,test this claim.Use: a.) a hypothesis test b.)an appropriate Clarrow_forward
- Assume that hybridization experiments are conducted with peas having the property that for offspring, there is a 0.75 probability that a pea has green pods. Assume that the offspring peas are randomly selected in groups of 24. Complete parts (a) through (c) below. a. Find the mean and the standard deviation for the numbers of peas with green pods in the groups of 24. The value of the mean is muμequals= peas. (Type an integer or a decimal. Do not round.) The value of the standard deviation is sigmaσequals= peas. (Round to one decimal place as needed.) b. Use the range rule of thumb to find the values separating results that are significantly low or significantly high. Values ofpeas or fewer are significantly low. (Round to one decimal place as needed.) Values of nothing peas or greater are significantly high. (Round to one decimal place as needed.) c. Is a result of 11 peas with green pods a result that is significantly low? Why or why not? The result ▼ is…arrow_forwardAssume that the sample is a simple random sample obtained from a normally distributed population of IQ scores of statistics professors. Use the table below to find the minimum sample size needed to be 95% confident that the sample standard deviation s is within 50% of a. Is this sample size practical? σ To be 95% confident that s is within of the value of o, the sample size In should be at least To be 99% confident that s is within of the value of o, the sample size In should be at least The minimum sample size needed is 1% 5% 19,205 768 10% 20% 30% 40% 50% 192 48 21 1% 5% 10% 20% 30% 40% 50% 33,218 1,336 336 85 12 8 38 22 14arrow_forwardQ1.) a) The following reading were recorded by testing measurementarrow_forward
- Assume that different groups of couples use a particular method of gender selection and each couple gives birth to one baby. This method is designed to increase the likelihood that each baby will be a girl, but assume that the method has no effect, so the probability of a girl is 0.5. Assume that the groups consist of 26 couples. Complete parts (a) through (c) below. a. Find the mean and the standard deviation for the numbers of girls in groups of 26 births. The value of the mean is μ = (Type an integer or a decimal. Do not round.). The value of the standard deviation is o= 0 (Round to one decimal place as needed) b. Use the range rule of thumb to find the values separating results that are significantly low or significantly high. Values of girls or fewer are significantly low. tion Viewer (Round to one decimal place as needed.) Values of airls or areater are significantly high.arrow_forwardA p value tells us: Group of answer choices a) the probability that we committed Type II error. b) the probability that our obtained score is true, assuming the null hypothesis is true. c) whether our test statistic is biased or not. d) whether our estimator is efficient.arrow_forward
arrow_back_ios
arrow_forward_ios
Recommended textbooks for you
- MATLAB: An Introduction with ApplicationsStatisticsISBN:9781119256830Author:Amos GilatPublisher:John Wiley & Sons Inc
 Probability and Statistics for Engineering and th...StatisticsISBN:9781305251809Author:Jay L. DevorePublisher:Cengage Learning
 Statistics for The Behavioral Sciences (MindTap C...StatisticsISBN:9781305504912Author:Frederick J Gravetter, Larry B. WallnauPublisher:Cengage Learning
  Elementary Statistics: Picturing the World (7th E...StatisticsISBN:9780134683416Author:Ron Larson, Betsy FarberPublisher:PEARSON
 The Basic Practice of StatisticsStatisticsISBN:9781319042578Author:David S. Moore, William I. Notz, Michael A. FlignerPublisher:W. H. Freeman
 Introduction to the Practice of StatisticsStatisticsISBN:9781319013387Author:David S. Moore, George P. McCabe, Bruce A. CraigPublisher:W. H. Freeman
MATLAB: An Introduction with Applications
Statistics
ISBN:9781119256830
Author:Amos Gilat
Publisher:John Wiley & Sons Inc
Probability and Statistics for Engineering and th...
Statistics
ISBN:9781305251809
Author:Jay L. Devore
Publisher:Cengage Learning
Statistics for The Behavioral Sciences (MindTap C...
Statistics
ISBN:9781305504912
Author:Frederick J Gravetter, Larry B. Wallnau
Publisher:Cengage Learning
Elementary Statistics: Picturing the World (7th E...
Statistics
ISBN:9780134683416
Author:Ron Larson, Betsy Farber
Publisher:PEARSON
The Basic Practice of Statistics
Statistics
ISBN:9781319042578
Author:David S. Moore, William I. Notz, Michael A. Fligner
Publisher:W. H. Freeman
Introduction to the Practice of Statistics
Statistics
ISBN:9781319013387
Author:David S. Moore, George P. McCabe, Bruce A. Craig
Publisher:W. H. Freeman