
MATLAB: An Introduction with Applications
6th Edition
ISBN: 9781119256830
Author: Amos Gilat
Publisher: John Wiley & Sons Inc
expand_more
expand_more
format_list_bulleted
Related questions
Topic Video
Question
thumb_up100%
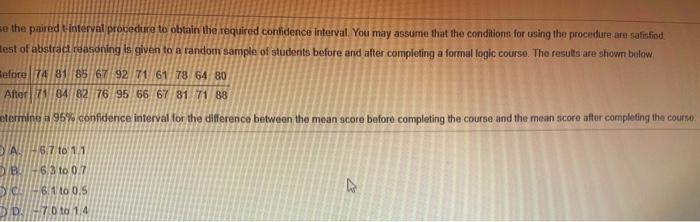

Transcribed Image Text:se the paired ttinterval procedure to obtain the required confidence interval. You may assume that the conditions for using the procedure are satisfiod
test of abstrad reasoning is given to a random sample of students before and after comipleting a formal logic course. The results are shown below
Sefore 74 81 85/67/92 71 61 78 64 80
After71 64/82 76 95 66 67 81 71 88
etermine a 95% confidence interval for the difference between the mean score before completing the course and the mean score after completing the course.
A-57 to 1.
63 to 0.7
61 to 0.5
D 70 to 1.4
Expert Solution
This question has been solved!
Explore an expertly crafted, step-by-step solution for a thorough understanding of key concepts.

Step by stepSolved in 2 steps with 2 images

Knowledge Booster


Learn more about
Need a deep-dive on the concept behind this application? Look no further. Learn more about this topic, statistics and related others by exploring similar questions and additional content below.Similar questions
- Construct a confidence interval of the population proportion at the given level of confidence. x=540, n=1200, 94% confidence The lower bound of the confidence interval is ______? (Round to three decimal places as needed.)arrow_forwardK Construct a confidence interval for P₁ P₂ at the given level of confidence. x₁ = 371, n₁ = 541, x2 = 446, n₂ = 565, 95% confidence GEEED The researchers are % confident the difference between the two population proportions, P₁-P2, is between (Use ascending order. Type an integer or decimal rounded to three decimal places as needed.) andarrow_forward5arrow_forward
- Construct a confidence interval of the population proportion at the given level of confidence. x=860, n=1200, 95% confidence The lower bound of the confidence interval is _____? (Round to three decimal places as needed.)arrow_forwardCurrent Attempt in Progress Two intervals are given, A and B, for the same value of the explanatory variable. A: 92 to 118; B: 84 to 126 ; (a) Which interval is the confidence interval for the mean response? Which interval is the prediction interval for the response? (b) What is the predicted value of the response variable for this value of the explanatory variable? Enter the exact answer. The predicted value is i eTextbook and Media e here to search hparrow_forwardConstruct a confidence interval of the population proportion at the given level of confidence. x=540, n=1200, 94% confidence The upper bound of the confidence interval is ______? (Round to three decimal places as needed.)arrow_forward
- b My Questions | bartleby W How To Delete Bartleby Accour X -com/courses/20952/assignments/284250 Express the confidence interval (525.4, 689) in the form of + ME. * + ME = 土 Question Help: Message instructor Submit Question 1,454 OCTarrow_forwardpbm 50arrow_forwardConstructing a Confidence Interval when the Population o is Unknown A pharmaceutical company makes tranquilizers. It is assumed that the distribution for the length of time they last is approximately normal but the population mean and standard deviation are not known. Researchers in a hospital used the drug on a random sample of nine patients. The sample mean was 2.51 hours. The sample standard deviation was 0.318. Work to construct a 95% confidence interval for the population mean by providing the following information. Useful tool: Student's t-Distribution Calculator (Include three decimal places below) а. а — b. v = c. to.025 d. EBM e. The lower bound of the Confidence Interval is f. The upper bound of the Confidence Interval isarrow_forward
arrow_back_ios
arrow_forward_ios
Recommended textbooks for you
- MATLAB: An Introduction with ApplicationsStatisticsISBN:9781119256830Author:Amos GilatPublisher:John Wiley & Sons Inc
 Probability and Statistics for Engineering and th...StatisticsISBN:9781305251809Author:Jay L. DevorePublisher:Cengage Learning
 Statistics for The Behavioral Sciences (MindTap C...StatisticsISBN:9781305504912Author:Frederick J Gravetter, Larry B. WallnauPublisher:Cengage Learning
  Elementary Statistics: Picturing the World (7th E...StatisticsISBN:9780134683416Author:Ron Larson, Betsy FarberPublisher:PEARSON
 The Basic Practice of StatisticsStatisticsISBN:9781319042578Author:David S. Moore, William I. Notz, Michael A. FlignerPublisher:W. H. Freeman
 Introduction to the Practice of StatisticsStatisticsISBN:9781319013387Author:David S. Moore, George P. McCabe, Bruce A. CraigPublisher:W. H. Freeman
MATLAB: An Introduction with Applications
Statistics
ISBN:9781119256830
Author:Amos Gilat
Publisher:John Wiley & Sons Inc
Probability and Statistics for Engineering and th...
Statistics
ISBN:9781305251809
Author:Jay L. Devore
Publisher:Cengage Learning
Statistics for The Behavioral Sciences (MindTap C...
Statistics
ISBN:9781305504912
Author:Frederick J Gravetter, Larry B. Wallnau
Publisher:Cengage Learning
Elementary Statistics: Picturing the World (7th E...
Statistics
ISBN:9780134683416
Author:Ron Larson, Betsy Farber
Publisher:PEARSON
The Basic Practice of Statistics
Statistics
ISBN:9781319042578
Author:David S. Moore, William I. Notz, Michael A. Fligner
Publisher:W. H. Freeman
Introduction to the Practice of Statistics
Statistics
ISBN:9781319013387
Author:David S. Moore, George P. McCabe, Bruce A. Craig
Publisher:W. H. Freeman