Essentials Of Investments
11th Edition
ISBN: 9781260013924
Author: Bodie, Zvi, Kane, Alex, MARCUS, Alan J.
Publisher: Mcgraw-hill Education,
expand_more
expand_more
format_list_bulleted
Question
thumb_up100%
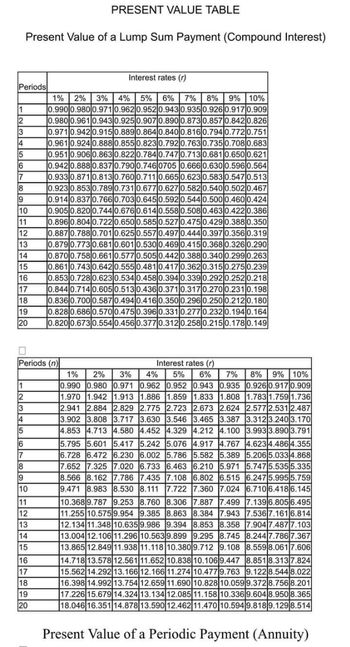
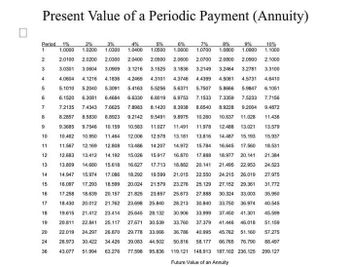
Use the attached present and future value tables to answer the following questions:
Tom pays $2,400 per year for rent on the first of January each year. He wants to deposit an amount in his 6% investment today that will allow him to draw $2,400 each year for the next 5 years. How much will he need to deposit today in order to draw $2,400 per year for 5 years?
Round percentages and ratios to the nearest tenth of a percent, dollars to nearest whole dollar
________dollars

Transcribed Image Text:# Present Value Table
## Present Value of a Lump Sum Payment (Compound Interest)
This table shows the present value of a lump sum payment for different numbers of periods and interest rates.
| Periods | Interest Rates (r) |
|---------|--------------------|
| | 1% 2% 3% 4% 5% 6% 7% 8% 9% 10% |
| 1 | 0.990 0.980 0.971 0.962 0.952 0.943 0.935 0.926 0.917 0.909 |
| 2 | 0.980 0.961 0.943 0.925 0.907 0.890 0.873 0.857 0.842 0.826 |
| 3 | 0.971 0.942 0.915 0.889 0.864 0.840 0.816 0.794 0.772 0.751 |
| 4 | 0.961 0.924 0.888 0.855 0.823 0.792 0.763 0.735 0.708 0.683 |
| 5 | 0.951 0.906 0.863 0.822 0.784 0.747 0.713 0.681 0.650 0.621 |
| 6 | 0.942 0.888 0.837 0.790 0.746 0.705 0.666 0.630 0.596 0.564 |
| 7 | 0.933 0.871 0.813 0.760 0.711 0.665 0.623 0.583 0.547 0.513 |
| 8 | 0.923 0.853 0.789 0.731 0.677 0.627 0.582 0.540 0.502 0.467 |
| 9 | 0.914 0.837 0.766 0.703 0.645 0.592 0.544 0

Transcribed Image Text:**Present Value of a Periodic Payment (Annuity)**
This table displays the future value of an annuity for various interest rates and periods. The table can be used to determine the present value of periodic payments, providing a comprehensive tool for financial planning.
### Table Columns:
- **Period:** Number of payment periods.
- **Interest Rates:** 1%, 2%, 3%, 4%, 5%, 6%, 7%, 8%, 9%, 10%.
### Example Entries:
- **Period 1:**
- 1%: 1.0000
- 2%: 1.0200
- 3%: 1.0300
- Up to 10%: 1.1000
- **Period 36:**
- 1%: 43.077
- 2%: 51.994
- 3%: 63.276
- Up to 10%: 299.127
### Explanation:
Each cell represents the present value of an annuity for a given period and interest rate. The higher the interest rate or the longer the period, the greater the future value, reflecting compound interest effects over time.
At the bottom of the table, it is indicated that the values represent the "Future Value of an Annuity," emphasizing their use in financial forecasting and decision-making.
Expert Solution
This question has been solved!
Explore an expertly crafted, step-by-step solution for a thorough understanding of key concepts.
This is a popular solution
Trending nowThis is a popular solution!
Step by stepSolved in 3 steps

Knowledge Booster
Learn more about
Need a deep-dive on the concept behind this application? Look no further. Learn more about this topic, finance and related others by exploring similar questions and additional content below.Similar questions
- You are planning to save for retirement over the next 25 years. To do this, you will invest $1,200 a month in a stock account and $900 a month in a bond account. The return of the stock account is expected to be 7 percent, and the bond account will pay 4 percent. When you retire, you will combine your money into an account with a return of 5 percent. How much can you withdraw each month from your account assuming a 20-year withdrawal period? Multiple Choice $621,766.96 $9,279.68 $9.469.06 $9,658.44 $113,628.75arrow_forwardyou have just won the lottery and will receive $460,000 in one year. you will receive payments for 21 years, and the payments will increase 4 percent per year. if the appropriate discount rate is 11 percent, what is the present value of your winnings? Please explain how to solve using the financial calculator to show and explain steps thanksarrow_forwardYou have $68,513 you want to invest. You are offered an investment plan that will pay you 4.58 percent per year for the first 20 years and 6.81 percent per year for the last 21 years. How much will you have (in $) at the end of the two periods? Answer to two decimals. < Previousarrow_forward
- Assume you won the state lottery and you are entitled to $5,000,000. If you choose not to take the money right away but wish to be paid weekly, you estimate that you will want to receive this cash flow over the next 10 years. How much will your weekly payment be at an interest rate of 5% ?arrow_forwardYou are planning to save for retirement over the next 30 years. To do this, you will invest $1,300 a month in a stock account and $1,000 a month in a bond account. The return of the stock account is expected to be 10 percent, and the bond account will pay 5 percent. When you retire, you will combine your money into an account with a return of 7 percent. How much can you withdraw each month from your account assuming a 15-year withdrawal period? Multiple Choice $1,102,254.13 $34.571.73arrow_forwardc) Retirement Investment: Savings at Retirement = Saving Periods = Interest Rate = Savings Deposit / month= monthly deposits / montharrow_forward
- If you invest $17,500 today, how much will you have in each of the following instances? Use Appendix A as an approximate answer, but calculate your final answer using the formula and financial calculator methods. a. In 7 years at 8 percent? Note: Do not round intermediate calculations. Round your final answer to 2 decimal places. Future value b. In 18 years at 7 percent? Note: Do not round intermediate calculations. Round your final answer to 2 decimal places. Future value c. In 25 years at 6 percent? Note: Do not round intermediate calculations. Round your final answer to 2 decimal places. Future value d. In 20 years at 6 percent (compounded semiannually)? Note: Do not round intermediate calculations. Round your final answer to 2 decimal places. Future valuearrow_forwardIf you invest $10,000 per period for the following number of periods, how much would you have in each of the following instances? Use Appendix C for an approximate answer, but calculate your final answer using the formula and financial calculator methods. In 50 years at 8 percent? (Do not round intermediate calculations. Round your final answer to 2 decimal places.)arrow_forwardSuppose an investment will pay $7,000 in 44 years from now. If you can earn 6.15% interest compounded monthly by depositing your money in a bank, how much should you pay for the investment today?Round your answer to two decimal places. For example, if your answer is $345.667 round as 345.67 and if your answer is .05718 or 5.718% round as 5.72. Group of answer choicesarrow_forward
- c. A person who invests $1, 600 each year finds one choice that is expected to pay 3 percent per year and another choice that may pay 4 percent. What is the difference in return if the investment is made for four years? Round your answer to the nearest dollar. (Hint: Use Appendox A-3 or the Garman/Forgue companion website.) Round Future Value of Series of Equal Amounts in intermediate calculations to four decimal places.arrow_forwardYou are looking at an investment that will make annual payments of $28,000, $32,000, $66,000, and $99,000 to you each year over the next four years, respectively. All payments will be made at the end of the year. If the appropriate interest rate is 3.6 percent, what is the value of the investment offer today?arrow_forwardYou plan to retire in 20 years. Use present value tables to calculate whether it is better for you tosave $25,000 a year for the last 10 years before retirement or $15,000 for each of the 20 years.Assume you are able to earn 10 percent interest on your investments. Round to the nearest dollar.arrow_forward
arrow_back_ios
SEE MORE QUESTIONS
arrow_forward_ios
Recommended textbooks for you
 Essentials Of InvestmentsFinanceISBN:9781260013924Author:Bodie, Zvi, Kane, Alex, MARCUS, Alan J.Publisher:Mcgraw-hill Education,

 Foundations Of FinanceFinanceISBN:9780134897264Author:KEOWN, Arthur J., Martin, John D., PETTY, J. WilliamPublisher:Pearson,
 Fundamentals of Financial Management (MindTap Cou...FinanceISBN:9781337395250Author:Eugene F. Brigham, Joel F. HoustonPublisher:Cengage Learning
 Corporate Finance (The Mcgraw-hill/Irwin Series i...FinanceISBN:9780077861759Author:Stephen A. Ross Franco Modigliani Professor of Financial Economics Professor, Randolph W Westerfield Robert R. Dockson Deans Chair in Bus. Admin., Jeffrey Jaffe, Bradford D Jordan ProfessorPublisher:McGraw-Hill Education

Essentials Of Investments
Finance
ISBN:9781260013924
Author:Bodie, Zvi, Kane, Alex, MARCUS, Alan J.
Publisher:Mcgraw-hill Education,


Foundations Of Finance
Finance
ISBN:9780134897264
Author:KEOWN, Arthur J., Martin, John D., PETTY, J. William
Publisher:Pearson,

Fundamentals of Financial Management (MindTap Cou...
Finance
ISBN:9781337395250
Author:Eugene F. Brigham, Joel F. Houston
Publisher:Cengage Learning

Corporate Finance (The Mcgraw-hill/Irwin Series i...
Finance
ISBN:9780077861759
Author:Stephen A. Ross Franco Modigliani Professor of Financial Economics Professor, Randolph W Westerfield Robert R. Dockson Deans Chair in Bus. Admin., Jeffrey Jaffe, Bradford D Jordan Professor
Publisher:McGraw-Hill Education