MATLAB: An Introduction with Applications
6th Edition
ISBN: 9781119256830
Author: Amos Gilat
Publisher: John Wiley & Sons Inc
expand_more
expand_more
format_list_bulleted
Question

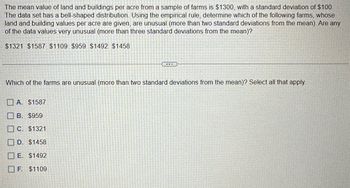
Transcribed Image Text:The mean value of land and buildings per acre from a sample of farms is $1300, with a standard deviation of $100.
The data set has a bell-shaped distribution. Using the empirical rule, determine which of the following farms, whose
land and building values per acre are given, are unusual (more than two standard deviations from the mean). Are any
of the data values very unusual (more than three standard deviations from the mean)?
$1321 $1587 $1109 $959 $1492 $1458
Which of the farms are unusual (more than two standard deviations from the mean)? Select all that apply.
A. $1587
B. $959
C. $1321
D. $1458
E. $1492
F. $1109
Expert Solution
arrow_forward
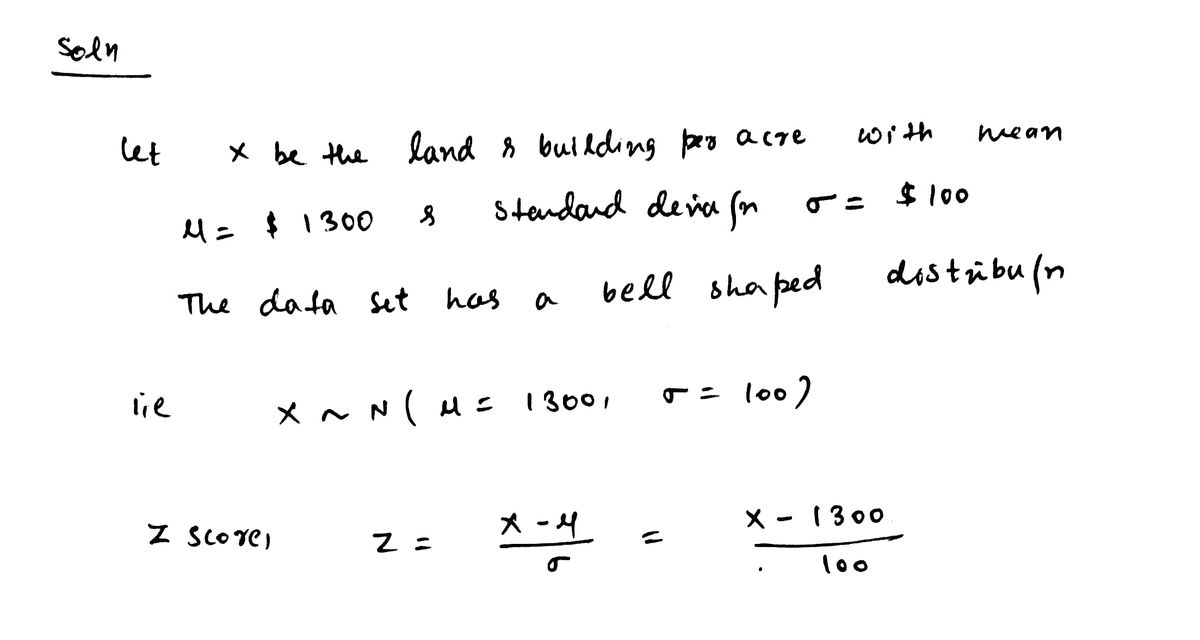
Step 1

Trending nowThis is a popular solution!
Step by stepSolved in 2 steps with 2 images

Knowledge Booster
Similar questions
- Which is the largest with regard to the following data set: the range or the standard deviation? 11 11 12 12 12 12 13 15 17 22 22 22 Standard Deviation Rangearrow_forwardConsider the following data set. You may assume that the mean of this data set is x¯ = 7. 8 10 3 5 7 5 11 a) Find the range of the data set. b) Find the standard deviation of the data set. c) How many of the seven data points lie within one standard deviation of the mean?arrow_forwardA population has a mean μ = 70 and a standard deviation o=36. Find the mean and standard deviation of a sampling distribution of sample means with sample size n = 81. H=(Simplify your answer.) = (Simplify your answer.)arrow_forward
- Find the range, vanance, and standard deviation for the given sample data. Include appropriate units in the results. Listed below are the measured radiation absorption rates (in Wikg) corresponding to various cell phone models. If one of each model is measured for radiation and the results are used to find the measures of variation, are the results typical of the population of cell phones that are in use? 1.16 0.82 0.51 0.69 1.11 0.82 0.69 0.75 0.52 0.53 1.34arrow_forwardFind the standard deviation.. Round to one more place than the data 7,19,20,8,17, 14, 8, 20, 12 O A. 5.1 O B. 1.7 O C. 5.4 O D. 5.7arrow_forwardRefer to the data set in the accompanying table. Assume that the paired sample data is a simple random sample and the differences have a distribution that is approximately normal. Use a significance level of 0.05 to test for a difference between the weights of discarded paper (in pounds) and weights of discarded plastic (in pounds). LOADING... Click the icon to view the data. In this example, μd is the mean value of the differences d for the population of all pairs of data, where each individual difference d is defined as the weight of discarded paper minus the weight of discarded plastic for a household. What are the null and alternative hypotheses for the hypothesis test? A. H0: μd≠0 H1: μd>0 B. H0: μd=0 H1: μd<0 C. H0: μd=0 H1: μd≠0 D. H0: μd≠0 H1: μd=0 Household Paper Plastic 1 6.44 8.40 2 7.72 3.86 3 3.27 0.63 4 9.19 3.74 5 14.33 6.43 6 11.08 12.47 7…arrow_forward
- The frequency distribution was obtained using a class width of 0.5 for data on cigarette tax rates. Use the frequency distribution to approximate the population mean and population standard deviation. Compare these results to the actual mean u = $1.506 and standard deviation o = $1.004. Click the icon to view the frequency distribution for the tax rates. Frequency distribution of cigarette tax rates Tax Rate Frequency 0.00–0.49 7 0.50-0.99 14 1.00–1.49 7 1.50–1.99 2.00–2.49 5 2.50–2.99 5 3.00–3.49 3.50–3.99 1 4.00-4.49 1arrow_forwardWhich of the following five statistics are commonly used together to determine the shape of a distribution? Five answers correct. All or nothing credit. 1. The minimum 2. Variance 3. The 2nd quartile 4. The maximum 5. Coefficient of variation 6. Interquartile range 7. The 1st quartile 8. The 3rd quartile 9. Range 10. Standard deviationarrow_forwardThe incomes of trainees at a local mill are normally distributed with a mean of $1,100 and a standard deviation of $150. What percentage of trainees earn more than $1,300 a month? Group of answer choices 9.18% 40.82% 90.82% 35.31%arrow_forward
arrow_back_ios
arrow_forward_ios
Recommended textbooks for you
 MATLAB: An Introduction with ApplicationsStatisticsISBN:9781119256830Author:Amos GilatPublisher:John Wiley & Sons Inc
 Probability and Statistics for Engineering and th...StatisticsISBN:9781305251809Author:Jay L. DevorePublisher:Cengage Learning
 Statistics for The Behavioral Sciences (MindTap C...StatisticsISBN:9781305504912Author:Frederick J Gravetter, Larry B. WallnauPublisher:Cengage Learning
 Elementary Statistics: Picturing the World (7th E...StatisticsISBN:9780134683416Author:Ron Larson, Betsy FarberPublisher:PEARSON
 The Basic Practice of StatisticsStatisticsISBN:9781319042578Author:David S. Moore, William I. Notz, Michael A. FlignerPublisher:W. H. Freeman
 Introduction to the Practice of StatisticsStatisticsISBN:9781319013387Author:David S. Moore, George P. McCabe, Bruce A. CraigPublisher:W. H. Freeman

MATLAB: An Introduction with Applications
Statistics
ISBN:9781119256830
Author:Amos Gilat
Publisher:John Wiley & Sons Inc

Probability and Statistics for Engineering and th...
Statistics
ISBN:9781305251809
Author:Jay L. Devore
Publisher:Cengage Learning

Statistics for The Behavioral Sciences (MindTap C...
Statistics
ISBN:9781305504912
Author:Frederick J Gravetter, Larry B. Wallnau
Publisher:Cengage Learning

Elementary Statistics: Picturing the World (7th E...
Statistics
ISBN:9780134683416
Author:Ron Larson, Betsy Farber
Publisher:PEARSON

The Basic Practice of Statistics
Statistics
ISBN:9781319042578
Author:David S. Moore, William I. Notz, Michael A. Fligner
Publisher:W. H. Freeman

Introduction to the Practice of Statistics
Statistics
ISBN:9781319013387
Author:David S. Moore, George P. McCabe, Bruce A. Craig
Publisher:W. H. Freeman