
A First Course in Probability (10th Edition)
10th Edition
ISBN: 9780134753119
Author: Sheldon Ross
Publisher: PEARSON
expand_more
expand_more
format_list_bulleted
Related questions
Question
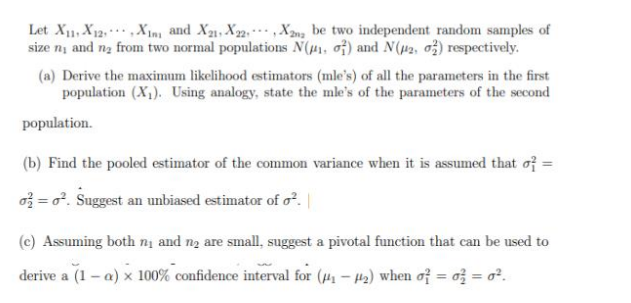

Transcribed Image Text:Let X₁, X12, Xim and X21, X22X2n be two independent random samples of
size n, and n₂ from two normal populations N(₁, 0) and N(2, 2) respectively.
(a) Derive the maximum likelihood estimators (mle's) of all the parameters in the first
population (X₁). Using analogy, state the mle's of the parameters of the second
population.
(b) Find the pooled estimator of the common variance when it is assumed that of =
o=0². Suggest an unbiased estimator of o².
(c) Assuming both n₁ and n₂ are small, suggest a pivotal function that can be used to
derive a (1-a) x 100% confidence interval for (#4₁-4₂) when o² = 0 = 0².
Expert Solution
This question has been solved!
Explore an expertly crafted, step-by-step solution for a thorough understanding of key concepts.
Step 1: . (a) Derive the maximum likelihood estimators (mle's) of all the parameters in the first populatio
VIEW Step 2: . (a) Derive the maximum likelihood estimators (mle's) of all the parameters in the first populatio
VIEW Step 3: . (b) Find the pooled estimator of the common variance when it is assumed that of = = o. Suggest an
VIEW Step 4: both the populations are normally distributed and population standard deviations are known, hence z-
VIEW Solution
VIEW 
Step by stepSolved in 5 steps with 13 images

Knowledge Booster

Similar questions
- Suppose that the general fertility rate, g f rt , is following an AR(1) process shown in the image below A) if y1<1, what is the expression for the mean and variance of g f t rt showing any assumptions that were made . b) suppose that Var (€|gfrt-1)= as shown in the image below. explain why you may not obtain a best linear unbiased estimator of y0 and y1 by estimating (3) using OLS.arrow_forwardA population is distributed with a known standard deviation, σ = 18 units. A random sample of size 35 is obtained from this population. The mean of this sample is 70. True or False: Since the sample size is greater than 25 the distribution of sample means from this population should be approximately normally distributed. What is the lower limit of the 95% confidence interval for the population mean μ? (2 dp) What is the upper limit of the 95% confidence interval for the population mean μ? (2 dp). Based on your confidence interval, would you believe that the true mean of this population could be 75?arrow_forwardLet X1, X2, .. ., Xn be a random sample from a normal distribution with mean u and variance o?. Find an estimator for o? using the method of moments. Is this estimator bi- ased/unbiased? Is it consistent?arrow_forward
- (e) Show that the sample mean of a simple random sample (drawn without replacement from a normal population) is dis- tributed normally with mean u and variance -² (1--=-1). n where N and n are population and sample sizes respectively. 4 In the 1 1 TIarrow_forwardI need help with this one, please. I need it to be step-by-step please for me to understand.arrow_forwardAn experiment is conducted to compare the maximum load capacity in tons (the maximum weight that can be tolerated without breaking) for two alloys A and B It is Kknown that the two standard deviations in load capacity are equal at 7 tons each. The experiment is conducted on 50 specimens of each alloy (A and B) and the results are X = 75.8. X = 71.8, and X-X=4. The manufacturers of alloy A are convinced that this evidence shows conclusively that Hug and strongly supports the claim that their alloy is superior. Manufacturers of alloy 8 claim that the experiment could easily have given X-X 4 even if the two population means are equal. Complete parts (a) and (b) below. Click here to view page 1 of the standard normal distribution table. Click here to view page 2 of the standard normal distribution table. (a) Make an argument that manufacturers of alloy B are wrong. Do it by computing P(XA-XB41 PA-HB) P(XA-X > 4) - @arrow_forward
- Suppose X1,..., Xn is a random sample from an exponential distribution with mean e. If X = 17.9 with n = 50, find (a) a one-sided 95% confidence interval for 0, and (b) a two-sided 95% confidence interval for 0.arrow_forwardA random sample of 10 observations from population A has sample mean of 152.3 and a sample standard deviation of 1.83. Another random sample of 8 observations from population B has a sample standard deviation of 1.94. Assuming equal variances in those two populations, a 99% confidence interval for μA − μB is (-0.19, 4.99), where μA is the mean in population A and μB is the mean in population B. (a) What is the sample mean of the observations from population B? (b) If we test H0 : μA ≤ μB against Ha : μA > μB, using α = 0.02, what is your conclusion?arrow_forwardX. is found to be 19.1, and the A simple random sample of sizen is drawn from a population that is normally distributed. The sample mean, sample standard deviation, s, is found to be 4.9. (a) Construct a 96% confidence interval about u if the sample size, n, is 39. (b) Construct a 96% confidence interval about u if the sample size, n, is 68. How does increasing the sample size affect the margin of error, E? (c) Construct a 98% confidence interval about u if the sample size, n, is 39. How does increasing the level of confidence affect the size of the margin of error, E? (d) If the sample size is 14, what conditions must be satisfied to compute the confidence interval? (a) Construct a 96% confidence interval about u if the sample size, n, is 39. Lower bound: Upper bound: (Round to two decimal places as needed.) (b) Construct a 96% confidence interval about u if the sample size, n, is 68. Lower bound: ; Upper bound: (Round to two decimal places as needed.) How does increasing the sample…arrow_forward
arrow_back_ios
arrow_forward_ios
Recommended textbooks for you
- A First Course in Probability (10th Edition)ProbabilityISBN:9780134753119Author:Sheldon RossPublisher:PEARSON

A First Course in Probability (10th Edition)
Probability
ISBN:9780134753119
Author:Sheldon Ross
Publisher:PEARSON