MATLAB: An Introduction with Applications
6th Edition
ISBN: 9781119256830
Author: Amos Gilat
Publisher: John Wiley & Sons Inc
expand_more
expand_more
format_list_bulleted
Question
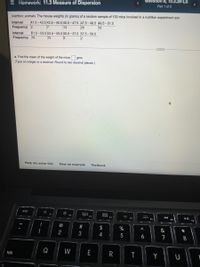
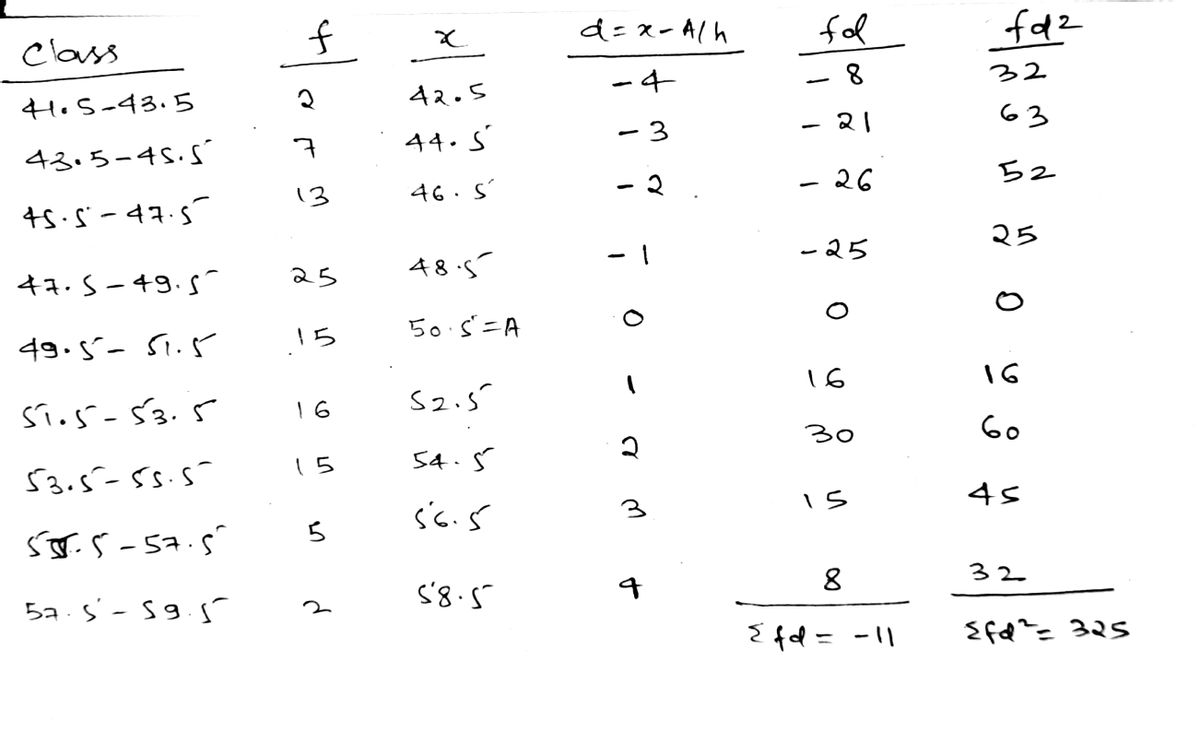
Find the mean of the weight of the mice and find the standard deviation of the weight of the mice there are two parts of this question.

Transcribed Image Text:Question 8, 10.3.26-LS
E Homework: 11.3 Measure of Dispersion
Part 1 of 2
Nutrition: animals. The mouse weights (in grams) of a random sample of 100 mice involved in a nutrition experiment are:
41.5-43.5 43.5-45.5 45.5-47.5 47.5-49.5 49.5-51.5
25
Interval
Frequency 2
7
13
15
51.5-53.5 53.5– 55.5 |55.5- 57.5 57.5- 59.5
5
Interval
Frequency 16
15
|2
a. Find the mean of the weight of the mice.
gms
(Type an integer or a decimal. Round to two decimal places.)
Help me solve this
View an example
Textbook
esc
80
F3
000
F1
F2
000 FA
@
$
%
&
*
2
3
4
6.
7
8
Q
W
E
R
Y
tab
Expert Solution
arrow_forward
Step 1

Trending nowThis is a popular solution!
Step by stepSolved in 2 steps with 2 images

Knowledge Booster
Similar questions
- True or false. If the standard deviation of a dataset is 0, the mean must also be 0.arrow_forwardwhat estimate does the range rule of thumb give you for the standard deviation?arrow_forwardIn a test, the average of the grades is 80 and the standard deviation is 5. John's grade is 70, so his grade is standard deviations the average. 2 below 10 --------- below 70 above equal toarrow_forward
- Why do deviation scores have to be squared before calculating the standard deviation? Squaring is necessary when calculating inferential statistics. If deviation scores are not squared, then the average distance from the mean will always equal 0. Squaring deviation scores allows for degrees of freedom to be calculated. If deviation scores are not squared, then the interquartile ranges are incalculable.arrow_forward3. 01:26:35 The following two-way table shows the distribution of daily traffic and weather issues in a certain large city. Suppose a day from this city is selected at random. Let event A = heavy traffic and event B = bad weather. Are events A and B independent? Daily Traffic No, P(A) = P(B|A). Нeavy Traffic Light Traffic Total O No, P(A) + P(A|B). O Yes, P(A) = P(A|B). O Yes, P(A) + P(B|A). Bad Weather 25 30 Good Weather 55 15 75 Total 80 20 100 Weather Conditionsarrow_forwardYou determine that the standard deviation for a sample of test scores is 0. This tells you that 1 all the test scores must be 0. 2 all the test scores must be the same value. 3 there is no straight-line association. 4 the mean test score must also be 0. 5 you made a mistake because the standard deviation can never be 0.arrow_forward
- The goal of the one-sample t-test is to: Group of answer choices describe the location of a score within a distribution compare the mean of a sample to the population mean. compare the means of two samples. compare the standard deviation of a sample to the standard deviation of the population.arrow_forwardFor an Economics test the mean score is 100 and the standard deviation is 10, and for an Accounting test the mean score is 50 and the standard deviation is 4. You are given the test scores of a student who took both tests. Determine on which test the student had a better score. Enter E if the student did better on the Economics test Enter A if the student did better on the Accounting test Enter S if the student did relatively the same on both tests. A student scores 125.6 on the Economics test and 60.2 on the Accounting test. The student did better/same on test.arrow_forwardGeorge has an average bowling score of 180 and bowls in a league where the average for all bowlers is 150 and the standard deviation is 20. Bill has an average bowling score of 190 and bowls in a league where the average is 160 and the standard deviation is 15. Who ranks higher in his own league, George or Bill? George because his standard score is higher than Bill's. Bill because his standard score is higher than George's. George because the standard deviation in his league is higher than the standard deviation in Bill's league. Bill because his 190 is higher than George's 180. Bill and George have the same rank in their leagues because both are 30 pins above the meanarrow_forward
arrow_back_ios
arrow_forward_ios
Recommended textbooks for you
 MATLAB: An Introduction with ApplicationsStatisticsISBN:9781119256830Author:Amos GilatPublisher:John Wiley & Sons Inc
 Probability and Statistics for Engineering and th...StatisticsISBN:9781305251809Author:Jay L. DevorePublisher:Cengage Learning
 Statistics for The Behavioral Sciences (MindTap C...StatisticsISBN:9781305504912Author:Frederick J Gravetter, Larry B. WallnauPublisher:Cengage Learning
 Elementary Statistics: Picturing the World (7th E...StatisticsISBN:9780134683416Author:Ron Larson, Betsy FarberPublisher:PEARSON
 The Basic Practice of StatisticsStatisticsISBN:9781319042578Author:David S. Moore, William I. Notz, Michael A. FlignerPublisher:W. H. Freeman
 Introduction to the Practice of StatisticsStatisticsISBN:9781319013387Author:David S. Moore, George P. McCabe, Bruce A. CraigPublisher:W. H. Freeman

MATLAB: An Introduction with Applications
Statistics
ISBN:9781119256830
Author:Amos Gilat
Publisher:John Wiley & Sons Inc

Probability and Statistics for Engineering and th...
Statistics
ISBN:9781305251809
Author:Jay L. Devore
Publisher:Cengage Learning

Statistics for The Behavioral Sciences (MindTap C...
Statistics
ISBN:9781305504912
Author:Frederick J Gravetter, Larry B. Wallnau
Publisher:Cengage Learning

Elementary Statistics: Picturing the World (7th E...
Statistics
ISBN:9780134683416
Author:Ron Larson, Betsy Farber
Publisher:PEARSON

The Basic Practice of Statistics
Statistics
ISBN:9781319042578
Author:David S. Moore, William I. Notz, Michael A. Fligner
Publisher:W. H. Freeman

Introduction to the Practice of Statistics
Statistics
ISBN:9781319013387
Author:David S. Moore, George P. McCabe, Bruce A. Craig
Publisher:W. H. Freeman