
ENGR.ECONOMIC ANALYSIS
14th Edition
ISBN: 9780190931919
Author: NEWNAN
Publisher: Oxford University Press
expand_more
expand_more
format_list_bulleted
Related questions
Question
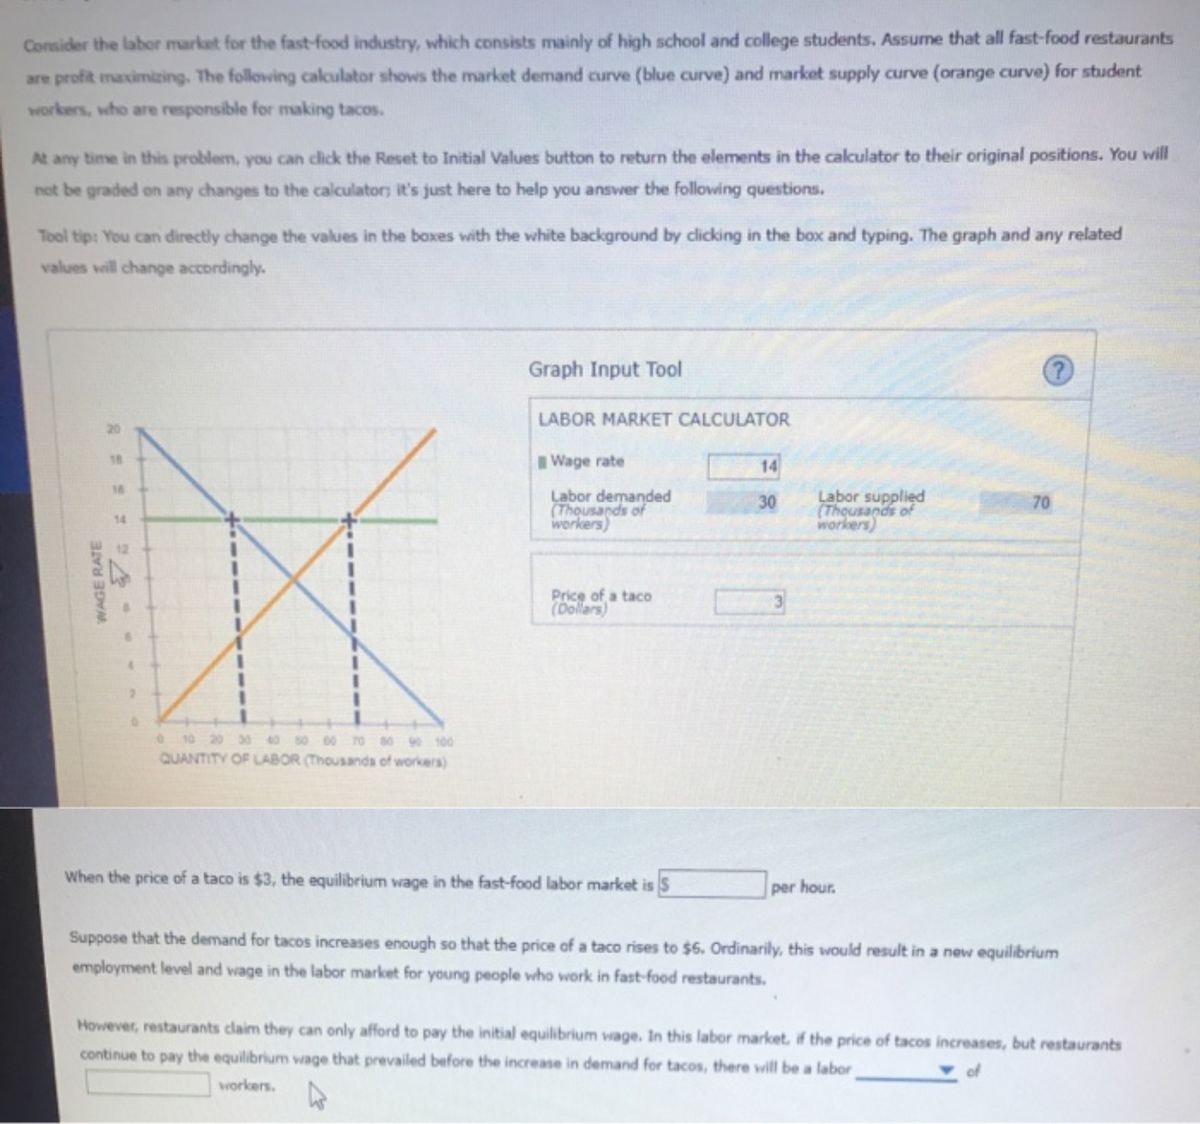

Transcribed Image Text:Consider the labor market for the fast-food industry, which consists mainly of high school and college students. Assume that all fast-food restaurants
are profit maximizing. The following calculator shows the market demand curve (blue curve) and market supply curve (orange curve) for student
workers, who are responsible for making tacos.
At any time in this problem, you can click the Reset to Initial Values button to return the elements in the calculator to their original positions. You will
not be graded on any changes to the calculator; it's just here to help you answer the following questions.
Tool tip: You can directly change the values in the boxes with the white background by clicking in the box and typing. The graph and any related
values will change accordingly.
WAGE RATE
IX
0 10 20 30 40 50 60 70 80 90 100
QUANTITY OF LABOR (Thousands of workers)
14
Graph Input Tool
LABOR MARKET CALCULATOR
Wage rate
Labor demanded
(Thousands of
workers)
Price of a taco
(Dollars)
When the price of a taco is $3, the equilibrium wage in the fast-food labor market is $
14
30
3
Labor supplied
(Thousands of
workers)
per hour.
(?)
70
Suppose that the demand for tacos increases enough so that the price of a taco rises to $6. Ordinarily, this would result in a new equilibrium
employment level and wage in the labor market for young people who work in fast-food restaurants.
However, restaurants claim they can only afford to pay the initial equilibrium wage. In this labor market, if the price of tacos increases, but restaurants
continue to pay the equilibrium wage that prevailed before the increase in demand for tacos, there will be a labor
workers.
Expert Solution
This question has been solved!
Explore an expertly crafted, step-by-step solution for a thorough understanding of key concepts.

Step by stepSolved in 2 steps

Knowledge Booster


Learn more about
Need a deep-dive on the concept behind this application? Look no further. Learn more about this topic, economics and related others by exploring similar questions and additional content below.Similar questions
- 4. The daily total product schedule for ACME Ltd. Is given below: Labor (workers) Total Product (boxes/day) 0 0 1 4 2 9 3 16 4 24 5 32 6 39 7 45 8 50 9 54 10 57 11 59 12 60 The cost of labor is $120/worker per day. The cost of capital is $300/day Plot accurately (use a graphing program) the following diagrams. Please put titles on the axes. a. The total product curve. b. The marginal product and average product curves (on the same diagram). Remember that marginal product represents a change and should be plotted at the midpoints e.g. the marginal product of the third worker should be plotted at 2.5 on the labor axis. c. The total cost curve. d. The marginal cost, average variable cost and average cost curves (on the same diagram). Remember that marginal cost represents a change and should be plotted at the midpoints.arrow_forwardHow would you calculate average product? How would you calculate marginal product?arrow_forwardTyped plz My feedback depends on how good quality answer I get Thanksarrow_forward
- 15. Refer to Figure 18-1. The relationship depicted on the graph is called a _______ function. 16. Refer to Figure 18-1. The production process depicted on the graph exhibits _______ marginal product of labor. 17. Refer to Figure 18-1. What is the marginal product of the second mechanic?arrow_forward66. Which of the following input factor takes risk, innovates and coordinates А. О Сapital В. Labour C. O Productivity D. O Entrepreneurarrow_forwardWeekly production for a potter varles with the number of workers employed, as shown in the table below. Number of workers 1 2 3 4 5 Total product (units of pots) Marginal product Average product 0 90 360 486 540 435 90 90 a. Enter the values of marginal product, when adding each worker, in the table above. Include a minus sign (-) when entering any negative values.arrow_forward
- 2 You run a business selling used hand tools. The rent on your building is $1400/month. Utilities average $600 month. Your average cost to buy your used hand tools from a wholesaler is $9.5/tool. You spend S0.50/tool to package and individually price them. You have two employees in your store during the opening hours that sell the tools. Each employee gets a salary of $12/hour. Your store is open 10 hours/day, every day of the week. Over the course of a year, this averages out to 30 days'month. The average selling price for a used tool is $22. How many tools per month must be sold to make $4000 profit each month.arrow_forwardCharlie owns his own candy factory where he employs individuals to make his world-famous toffee. The graphs show the factory's production for one day. Charlie pays each worker $110 a day and sells his toffee for $0.50 each. Use the accompanying graph to answer the following 2080 1960 Total product questions. 1800 1600 a. Calculate the marginal product of labor (MPL) for the fifth and eighth workers. 1360 1080 760 MPL 5thworker units 400 6. 10 MPL units gth worker Ouantity of workers Quantity of toffee (units)arrow_forwardplease help me solve this question step by step. Thank youarrow_forward
- 18. What word do we use to refer to the amount of goods and services produced for each hour of a worker’s time?arrow_forward16. The marginal physical product of the third unit of labour in Figure 1.4 Figure 1.4 50 48 40 Total output 28 12 3. 4 Labor Input (workers per day) a. 40.0 units per day b. 12.0 units per day c. 13.3 units per day d. 4.0 units per day indino (units per day)arrow_forwardIf 11 workers can produce a total of 54 units of a product and a 12th worker has a marginal product of 6 units, what is the average product of 12 workers?arrow_forward
arrow_back_ios
SEE MORE QUESTIONS
arrow_forward_ios
Recommended textbooks for you
 Principles of Economics (12th Edition)EconomicsISBN:9780134078779Author:Karl E. Case, Ray C. Fair, Sharon E. OsterPublisher:PEARSON
 Engineering Economy (17th Edition)EconomicsISBN:9780134870069Author:William G. Sullivan, Elin M. Wicks, C. Patrick KoellingPublisher:PEARSON
 Principles of Economics (MindTap Course List)EconomicsISBN:9781305585126Author:N. Gregory MankiwPublisher:Cengage Learning
 Managerial Economics: A Problem Solving ApproachEconomicsISBN:9781337106665Author:Luke M. Froeb, Brian T. McCann, Michael R. Ward, Mike ShorPublisher:Cengage Learning
 Managerial Economics & Business Strategy (Mcgraw-...EconomicsISBN:9781259290619Author:Michael Baye, Jeff PrincePublisher:McGraw-Hill Education
Principles of Economics (12th Edition)
Economics
ISBN:9780134078779
Author:Karl E. Case, Ray C. Fair, Sharon E. Oster
Publisher:PEARSON
Engineering Economy (17th Edition)
Economics
ISBN:9780134870069
Author:William G. Sullivan, Elin M. Wicks, C. Patrick Koelling
Publisher:PEARSON
Principles of Economics (MindTap Course List)
Economics
ISBN:9781305585126
Author:N. Gregory Mankiw
Publisher:Cengage Learning
Managerial Economics: A Problem Solving Approach
Economics
ISBN:9781337106665
Author:Luke M. Froeb, Brian T. McCann, Michael R. Ward, Mike Shor
Publisher:Cengage Learning
Managerial Economics & Business Strategy (Mcgraw-...
Economics
ISBN:9781259290619
Author:Michael Baye, Jeff Prince
Publisher:McGraw-Hill Education