
MATLAB: An Introduction with Applications
6th Edition
ISBN: 9781119256830
Author: Amos Gilat
Publisher: John Wiley & Sons Inc
expand_more
expand_more
format_list_bulleted
Related questions
Question
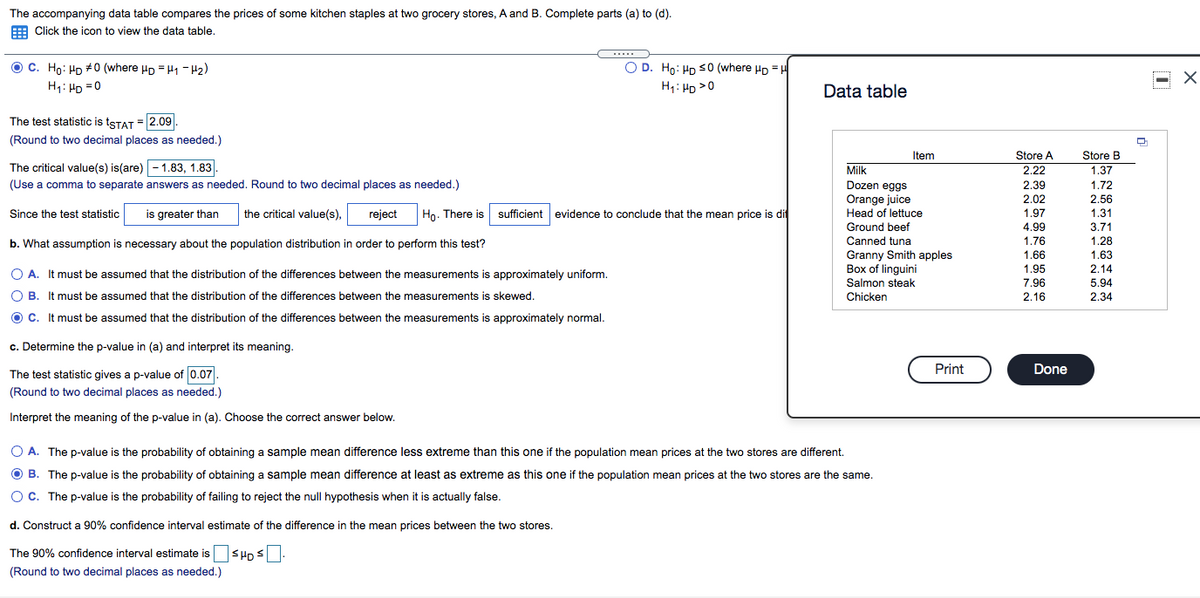
The accompanying data table compares the prices of some kitchen staples at two grocery stores, A and B. Complete parts (a) to (d).
i only want part D solved

Transcribed Image Text:The accompanying data table compares the prices of some kitchen staples at two grocery stores, A and B. Complete parts (a) to (d).
E Click the icon to view the data table.
.....
O C. Ho: Hp #0 (where up =H1 - H2)
O D. Ho: HD S0 (where Hp = H
H1: HD =0
H: HD >0
...
Data table
The test statistic is tSTAT = 2.09.
(Round to two decimal places as needed.)
Item
Store A
Store B
The critical value(s) is(are) - 1.83, 1.83
Milk
2.22
1.37
(Use a comma to separate answers as needed. Round to two decimal places as needed.)
Dozen eggs
2.39
1.72
Orange juice
orang
Head of lettuce
2.02
2.56
Since the test statistic
is greater than
the critical value(s),
reject
Họ. There is sufficient evidence to conclude that the mean price is di
1.97
1.31
Ground beef
4.99
3.71
1.28
1.63
2.14
b. What assumption is necessary about the population distribution in order to perform this test?
Canned tuna
1.76
Granny Smith apples
Box of linguini
Salmon steak
1.66
1.95
7.96
2.16
O A. It must be assumed that the distribution of the differences between the measurements is approximately uniform.
5.94
O B. It must be assumed that the distribution of the differences between the measurements is skewed.
Chicken
2.34
O C. It must be assumed that the distribution of the differences between the measurements is approximately normal.
c. Determine the p-value in (a) and interpret its meaning.
The test statistic gives a p-value of 0.07.
Print
Done
(Round to two decimal places as needed.)
Interpret the meaning of the p-value in (a). Choose the correct answer below.
O A. The p-value is the probability of obtaining a sample mean difference less extreme than this one if the population mean prices at the two stores are different.
O B. The p-value is the probability of obtaining a sample mean difference at least as extreme as this one if the population mean prices at the two stores are the same.
OC. The p-value is the probability of failing to reject the null hypothesis when it is actually false.
d. Construct a 90% confidence interval estimate of the difference in the mean prices between the two stores.
The 90% confidence interval estimate isSHDS
(Round to two decimal places as needed.)
Expert Solution
This question has been solved!
Explore an expertly crafted, step-by-step solution for a thorough understanding of key concepts.

Step by stepSolved in 2 steps with 2 images

Knowledge Booster

Similar questions
- A marketing manager for a large cafeteria chain wished to investigate sales of coffee (i.e., sales is the variable she is trying to understand). Fourteen cafeterias that were similar in such respects as volume of business, type of clientele, and location were chosen for data collection. Data were collected on sales of coffee (in hundreds of gallons) and the number of coffee dispensers within the cafeteria. The results are shown below. Sales Number of Dispensers 631.9 1 628 1 692.5 2 688.4 2 747.4 3 773.3 3 791.4 4 803.4 4 838.7 5 879.6 5 881 6 841.1 6 860.6 7 883.8 7 Create a scatter plot and then fit a quadratic model to predict sales from the number of dispensers. If we define y to be sales (in hundreds of gallons) and x to be the number of dispensers, what is the correct quadratic model? Group of answer choices a. y=-6.397x2+92.85x+538.06 b. y=41.67x+614.829 c. y=0.022x-12.979 d. y=3.348x10-5x2-0.0292x+6.09 e. y=623.521x0.180arrow_forward3. of a tank of gas when it is cut (on average). 16 Diragio Lawn Care cuts 42 lawns every week. Each lawn uses Part A If the lawnmower had no gas at the start of the week, how many times would it have to be completely filled during the week? Show your work. Part B. The cost for a full tank of gas in the lawnmower is $20. How much does it cost (in lawnmower fuel only) to mow one average lawn? Show your work. BIU E E X, xarrow_forward2. Your prank war has continued to accelerate. You decide to cover your friend's car with post- it notes. How many post-it notes would you have to buy if each post-it note package contains 500 sticky notes at 3 inches x 3 inches in size. Your friend drives a 2021 Jeep Wrangler. (Hint: start by finding the dimensions of the jeep).arrow_forward
- 1. To travel outside the city limits, a certain taxicab company charges $1.20 for the first mile or less of travel. After the first mile, the charge is an additional $0.90 per mile. Complete the following table. x, NUMBER OF MILES OUTSIDE CITY LIMITS 0. 0.5 1 10 c, TOTAL COST (IN $) a. Write an equation for the total cost, C, of the first mile or less of travel. b. Write an equation that gives the total cost, C, if you travel more than 1 mile, all outside city limits. c. Write a piecewise function for the total cost, C. 2.arrow_forwardPLEASE ANSWER EVERYTHING. I WILL UPVOTE ALL I PROMISE.arrow_forwardA group of sales reps receive bonuses if they exceed theier monthly quotas for unit sales. Over a particular six-month period, their monthly comparisons to their quotas were: -24, -16, +33, +12, -19, and +8 units. How far above or below the quotas were they for the entire six-month period?arrow_forward
- FIND THE ANSWERS FOR B-2 and C. A survey found that Massachusetts residents spent an average of $861.75 on the lottery, more than three times the U.S. average. A researcher at a Boston think tank believes that Massachusetts residents spend less than this amount. He surveys 100 Massachusetts residents and asks them about their annual expenditures on the lottery. (You may find it useful to reference the t table.) Click here for the Excel Data File a. Specify the competing hypotheses to test the researcher’s claim.multiple choice 1 H0: μ ≥ 861.75; HA: μ < 861.75 b-1. Calculate the value of the test statistic. (Negative value should be indicated by a minus sign. Round final answer to 3 decimal places.) -0.863 b-2. Find the p-value.multiple choice 2 p-value < 0.01 0.01 p-value < 0.025 0.025 p-value < 0.05 0.05 p-value < 0.10 p-value 0.10 c. At α = 0.10, what is the conclusion?multiple choice 3 Reject H0; there is insufficient evidence…arrow_forward15. Enrique bought lunch for himself and 3 of his friends. He spent a total of $55.40. If each of the lunches cost the same amount, what was the cost of one lunch? (TEKS 6.3E, RS, RC2) A. $13.85 B. $221.60 C. $18.47 D. $51.40arrow_forwardBlake and April are both taking AP Calculus, but they have different teachers who have two different grading systems. Blake is in Mr. Frey’s class and April is in Coach Smith’s class. Blake is mad because she thinks that with her averages, she would have a higher average in Coach Smith’s class. Given her averages below, what would be her overall average for each class? Round to the nearest whole number. Mr. Frey’s Class (Blake) Coach Smith’s Class (April) Test 35% Quiz 20%Homework 10% Classwork 15%Final Exam 20% Test 45%Quiz 20%Homework 10% Classwork 10%Final Exam 15% Test Quiz HW CW Final Exam 84 75 90 85 90 Blake’s grade with Mr. Frey Blake’s grade with Coach Smitharrow_forward
arrow_back_ios
SEE MORE QUESTIONS
arrow_forward_ios
Recommended textbooks for you
- MATLAB: An Introduction with ApplicationsStatisticsISBN:9781119256830Author:Amos GilatPublisher:John Wiley & Sons Inc
 Probability and Statistics for Engineering and th...StatisticsISBN:9781305251809Author:Jay L. DevorePublisher:Cengage Learning
 Statistics for The Behavioral Sciences (MindTap C...StatisticsISBN:9781305504912Author:Frederick J Gravetter, Larry B. WallnauPublisher:Cengage Learning
  Elementary Statistics: Picturing the World (7th E...StatisticsISBN:9780134683416Author:Ron Larson, Betsy FarberPublisher:PEARSON
 The Basic Practice of StatisticsStatisticsISBN:9781319042578Author:David S. Moore, William I. Notz, Michael A. FlignerPublisher:W. H. Freeman
 Introduction to the Practice of StatisticsStatisticsISBN:9781319013387Author:David S. Moore, George P. McCabe, Bruce A. CraigPublisher:W. H. Freeman
MATLAB: An Introduction with Applications
Statistics
ISBN:9781119256830
Author:Amos Gilat
Publisher:John Wiley & Sons Inc
Probability and Statistics for Engineering and th...
Statistics
ISBN:9781305251809
Author:Jay L. Devore
Publisher:Cengage Learning
Statistics for The Behavioral Sciences (MindTap C...
Statistics
ISBN:9781305504912
Author:Frederick J Gravetter, Larry B. Wallnau
Publisher:Cengage Learning
Elementary Statistics: Picturing the World (7th E...
Statistics
ISBN:9780134683416
Author:Ron Larson, Betsy Farber
Publisher:PEARSON
The Basic Practice of Statistics
Statistics
ISBN:9781319042578
Author:David S. Moore, William I. Notz, Michael A. Fligner
Publisher:W. H. Freeman
Introduction to the Practice of Statistics
Statistics
ISBN:9781319013387
Author:David S. Moore, George P. McCabe, Bruce A. Craig
Publisher:W. H. Freeman