MATLAB: An Introduction with Applications
6th Edition
ISBN: 9781119256830
Author: Amos Gilat
Publisher: John Wiley & Sons Inc
expand_more
expand_more
format_list_bulleted
Question
thumb_up100%

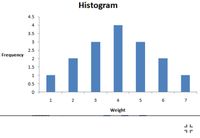
Transcribed Image Text:Histogram
4.5
4
3.5
3
2.5
Frequency
2
1.5
1
0.5
3
6
7
Weight
5.
2.

Transcribed Image Text:e) By examining the histogram of the weight data, determine the percent of the
data that fall within 1 standard deviation of the mean.
e)_
Expert Solution
This question has been solved!
Explore an expertly crafted, step-by-step solution for a thorough understanding of key concepts.
This is a popular solution
Trending nowThis is a popular solution!
Step by stepSolved in 2 steps

Knowledge Booster
Similar questions
- Which type of data is the strongest data for statistical analysis?arrow_forwardIt has been found that with the standard dosage of a drug, the change in people’s uric acid levelis normally distributed with a mean of 240 and a standard deviation of 60. What proportionof people receiving the standard dosage of this drug experience changes in uric acid levelbetween 210 and 270?arrow_forwardDescribe the scores in a sample that has a standard deviation of zeroarrow_forward
- In a normal distribution, what percentage of scores falls below and score of -2.33arrow_forwardSuppose that you were interested in investigating the effect of a drug that is to be used in the treatment of patients who have glaucoma in both eyes. A comparison between the mean reduction in eye pressure for this drug and for a standard treatment is desired. Both treatments are applied directly to the eye. (a) Describe a reasonable method of collecting data that would result in paired samples. Gather a number of volunteers who suffer from glaucoma in both eyes. Measure the pressure in each eye of each participant before the treatments begin. For each experimental subject, randomly assign the treatments to each participant. Once the patients have applied the treatments for a fixed time, measure again the pressures in all the eyes, and compare the mean reduction in pressure for the eyes that have received the new treatment with the mean reduction in pressure for those that have received the standard treatment. O Gather a number of volunteers who suffer from glaucoma in both eyes.…arrow_forwardIn general, how is the magnitude of the standard error of estimate related to the value of the correlation?arrow_forward
- The distribution for the time a patient of a medical center spends waiting for an appointment is normal with mean of 35 minutes and standard deviation of 12 minutes. What percentage of patients will wait less than or equal to 40 minutes for an appointment?arrow_forwardThe scores on a standardized test are normally distributed with a mean of 95 and standard deviation of 25. What test score is 0.3 standard deviations below the mean?arrow_forwardThe height of men in country is normally distributed with mean of 6 feet and variance of 16 inches. What percentage the male population is between 72 and 76 inches in height?arrow_forward
- The distribution for the time a patient of a medical center spends waiting for an appointment is normal with mean of 35 minutes and standard deviation of 12 minutes. How many minutes wait time represents the 80th percentile?arrow_forwardAccording to the Empirical Rule, in a Normal Distribution of data you will have percent of the data within 1 standard deviation of the mean, percent of the data within 2 standard deviation of the mean, and percent of the data within 3 standard deviation of the mean.arrow_forwardDescribe the three measures of variability; the range, variance, and standard deviation. Explain the impact of outliers on measures of variability.arrow_forward
arrow_back_ios
SEE MORE QUESTIONS
arrow_forward_ios
Recommended textbooks for you
 MATLAB: An Introduction with ApplicationsStatisticsISBN:9781119256830Author:Amos GilatPublisher:John Wiley & Sons Inc
 Probability and Statistics for Engineering and th...StatisticsISBN:9781305251809Author:Jay L. DevorePublisher:Cengage Learning
 Statistics for The Behavioral Sciences (MindTap C...StatisticsISBN:9781305504912Author:Frederick J Gravetter, Larry B. WallnauPublisher:Cengage Learning
 Elementary Statistics: Picturing the World (7th E...StatisticsISBN:9780134683416Author:Ron Larson, Betsy FarberPublisher:PEARSON
 The Basic Practice of StatisticsStatisticsISBN:9781319042578Author:David S. Moore, William I. Notz, Michael A. FlignerPublisher:W. H. Freeman
 Introduction to the Practice of StatisticsStatisticsISBN:9781319013387Author:David S. Moore, George P. McCabe, Bruce A. CraigPublisher:W. H. Freeman

MATLAB: An Introduction with Applications
Statistics
ISBN:9781119256830
Author:Amos Gilat
Publisher:John Wiley & Sons Inc

Probability and Statistics for Engineering and th...
Statistics
ISBN:9781305251809
Author:Jay L. Devore
Publisher:Cengage Learning

Statistics for The Behavioral Sciences (MindTap C...
Statistics
ISBN:9781305504912
Author:Frederick J Gravetter, Larry B. Wallnau
Publisher:Cengage Learning

Elementary Statistics: Picturing the World (7th E...
Statistics
ISBN:9780134683416
Author:Ron Larson, Betsy Farber
Publisher:PEARSON

The Basic Practice of Statistics
Statistics
ISBN:9781319042578
Author:David S. Moore, William I. Notz, Michael A. Fligner
Publisher:W. H. Freeman

Introduction to the Practice of Statistics
Statistics
ISBN:9781319013387
Author:David S. Moore, George P. McCabe, Bruce A. Craig
Publisher:W. H. Freeman