
MATLAB: An Introduction with Applications
6th Edition
ISBN: 9781119256830
Author: Amos Gilat
Publisher: John Wiley & Sons Inc
expand_more
expand_more
format_list_bulleted
Related questions
Question
thumb_up100%
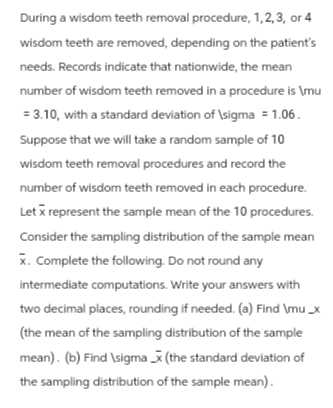

Transcribed Image Text:During a wisdom teeth removal procedure, 1, 2, 3, or 4
wisdom teeth are removed, depending on the patient's
needs. Records indicate that nationwide, the mean
number of wisdom teeth removed in a procedure is \mu
= 3.10, with a standard deviation of \sigma = 1.06.
Suppose that we will take a random sample of 10
wisdom teeth removal procedures and record the
number of wisdom teeth removed in each procedure.
Let x represent the sample mean of the 10 procedures.
Consider the sampling distribution of the sample mean
x. Complete the following. Do not round any
intermediate computations. Write your answers with
two decimal places, rounding if needed. (a) Find \mu_x
(the mean of the sampling distribution of the sample
mean). (b) Find \sigmax (the standard deviation of
the sampling distribution of the sample mean).
Expert Solution
This question has been solved!
Explore an expertly crafted, step-by-step solution for a thorough understanding of key concepts.

This is a popular solution

Trending nowThis is a popular solution!

Step by stepSolved in 4 steps with 4 images

Knowledge Booster

Similar questions
- According to AC Lens, green eye color is one of the rarest with only 2% of the world's population having that eye color. A random sample of 1000 people from around the world are selected. Let ?ˆp^ be the proportion of the sample which has green eyes. What is the mean of the sample proportion? Answerarrow_forwardAssume that scores on a bone mineral desity test are normally distributed with a mean of 0 and a standard deviation of 1. b. what do the symbols mean^2 and standard deviation ^2 represent.arrow_forwardThe lengths of a particular animal's pregnancies are approximately normally distributed, with mean = 251 days and standard deviation = 12 days. A "very preterm" baby is one whose gestation period is less than 233 days. Are very preterm babies unusual?arrow_forward
- The scores of students on a standardized test form a normal distribution with a mean of 300 and a standard deviation of 40. Using the fact that the middle 50% of the data falls within .67 standard deviations from the mean, find the lower and upper quartile scores for this test.arrow_forwardWhen Emma commutes to work, the amount of time it takes her to arrive is normally distributed with a mean of 53 minutes and a standard deviation of 5 minutes. What percentage of her commutes will be shorter than 62 minutes, to the nearest tenth? Statistics Calculatorarrow_forwardThe time for an event for girls in secondary school is known to posses a normal distribution within a mean of 450 seconds and a standard deviation of 50 seconds. Find the probablity that a randomly selected girl in a secondary school will take longer 335 seconds to run the milearrow_forward
- Low‑density lipoprotein, or LDL, is the main source of cholesterol buildup and blockage in the arteries. This is why LDL is known as "bad cholesterol." LDL is measured in milligrams per deciliter of blood, or mg/dL. In a population of adults at risk for cardiovascular problems, the distribution of LDL levels is normal, with a mean of 123123 mg/dL and a standard deviation of 4141 mg/dL. If an individual's LDL is at least 11 standard deviation or more above the mean, he or she will be monitored carefully by a doctor. What percentage of individuals from this population will have LDL levels 11 or more standard deviations above the mean? Use the 6868–9595–99.799.7 rule. (Enter your exact answer as a whole number.)arrow_forwardThe Census Bureau reports that 82% of Americans over the age of 25 are high school graduates. A survey of randomly selected residents of certain county included 1100 who were over the age of 25, and 871 of them were high school graduates, (a) Find the mean and standard deviation for the number of high school graduates in groups of 1100 Americans over the age of 25. Mean = %3D Standard deviation = (b) Is that county result of 871 unusually high, or low, or neither? (Enter HIGH or LOW or NEITHER) Give your answers exactly, or to at least 4 decimal places.arrow_forwardAccording to data from the U.S. Army the average foot length of women as normally distributed with a mean of 9.6 inches and a standard deviation of 0.5 inches. Find P95 (that is the top 5% of women’s foot length)arrow_forward
- According to a report published by the USDA 3 years ago, a typical American consumes an average of 26 pounds of ice cream per year. A researcher at the USDA would like to determine if the average amount of ice cream consumed each year by a typical American has changed since the original report was published. The researcher collected data from a random sample of 65 Americans and found that the mean amount of ice cream consumed each year by the sample was 25.54 pounds with a standard deviation of 1.64 pounds. Using α=0.02, test the hypothesis that the mean amount of ice cream consumed each year by a typical American is different than 26 pounds. Use the p-value method. State the null and alternative hypothesis for this test. H0= H1= Determine the test statistic for the hypothesis test. Round the solution to four decimal places. =arrow_forwardFrom Open Intro Statistics) The National Survey of Family Growth conducted by the Center for Disease Control gathers information on family life, marriage and divorce, pregnancy, infertility, use of contraception, and men’s and women’s health. One of the variables collected on this survey is the age at first marriage. 5,534 women, randomly sampled between 2006 and 2010, had a mean age of first marriage of 23.44 years with a standard deviation of 4.72 years. Find a 90% confidence interval for the mean age of first marriage of women in the population.arrow_forward
arrow_back_ios
arrow_forward_ios
Recommended textbooks for you
- MATLAB: An Introduction with ApplicationsStatisticsISBN:9781119256830Author:Amos GilatPublisher:John Wiley & Sons Inc
 Probability and Statistics for Engineering and th...StatisticsISBN:9781305251809Author:Jay L. DevorePublisher:Cengage Learning
 Statistics for The Behavioral Sciences (MindTap C...StatisticsISBN:9781305504912Author:Frederick J Gravetter, Larry B. WallnauPublisher:Cengage Learning
  Elementary Statistics: Picturing the World (7th E...StatisticsISBN:9780134683416Author:Ron Larson, Betsy FarberPublisher:PEARSON
 The Basic Practice of StatisticsStatisticsISBN:9781319042578Author:David S. Moore, William I. Notz, Michael A. FlignerPublisher:W. H. Freeman
 Introduction to the Practice of StatisticsStatisticsISBN:9781319013387Author:David S. Moore, George P. McCabe, Bruce A. CraigPublisher:W. H. Freeman
MATLAB: An Introduction with Applications
Statistics
ISBN:9781119256830
Author:Amos Gilat
Publisher:John Wiley & Sons Inc
Probability and Statistics for Engineering and th...
Statistics
ISBN:9781305251809
Author:Jay L. Devore
Publisher:Cengage Learning
Statistics for The Behavioral Sciences (MindTap C...
Statistics
ISBN:9781305504912
Author:Frederick J Gravetter, Larry B. Wallnau
Publisher:Cengage Learning
Elementary Statistics: Picturing the World (7th E...
Statistics
ISBN:9780134683416
Author:Ron Larson, Betsy Farber
Publisher:PEARSON
The Basic Practice of Statistics
Statistics
ISBN:9781319042578
Author:David S. Moore, William I. Notz, Michael A. Fligner
Publisher:W. H. Freeman
Introduction to the Practice of Statistics
Statistics
ISBN:9781319013387
Author:David S. Moore, George P. McCabe, Bruce A. Craig
Publisher:W. H. Freeman