
MATLAB: An Introduction with Applications
6th Edition
ISBN: 9781119256830
Author: Amos Gilat
Publisher: John Wiley & Sons Inc
expand_more
expand_more
format_list_bulleted
Related questions
Concept explainers
Topic Video
Question
c. this test statistic for data =
d. the p-value for this sample =
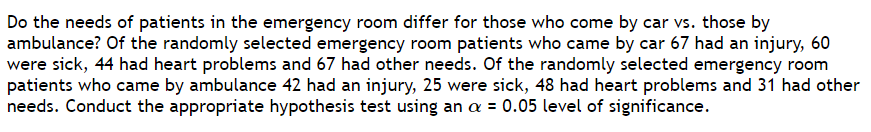

Transcribed Image Text:Do the needs of patients in the emergency room differ for those who come by car vs. those by
ambulance? Of the randomly selected emergency room patients who came by car 67 had an injury, 60
were sick, 44 had heart problems and 67 had other needs. Of the randomly selected emergency room
patients who came by ambulance 42 had an injury, 25 were sick, 48 had heart problems and 31 had other
needs. Conduct the appropriate hypothesis test using an a = 0.05 level of significance.
Expert Solution
This question has been solved!
Explore an expertly crafted, step-by-step solution for a thorough understanding of key concepts.

Step by stepSolved in 3 steps

Knowledge Booster


Learn more about
Need a deep-dive on the concept behind this application? Look no further. Learn more about this topic, statistics and related others by exploring similar questions and additional content below.Similar questions
- Using the following set of data (the same as in the previous problem), find the sample standard deviation:8, 7, 11, 10, 10, 8.arrow_forwardQ3. Paired sample t test can be used in an analysis involving pre-test and post-test data or in cross-over trials. YesB. NoC. None of the abovearrow_forwardwhat is the mean and standard deviation of the following sample: 18, 1, 5, 1, 5arrow_forward
- I am lookin for the relationship between the sample mean and the population mean and also the relationship between the standard error and the sample size.arrow_forwardwhat is the second quartilearrow_forwardConsider the following data: 2, 10, 14, 12, 4, 4, 10 Step 1 of 3: Calculate the value of the sample variance. Round your answer to one decimal place.arrow_forward
- c. The test-statistic for this data = (Please show your answer to three decimal places.) d. The p-value for this sample (Please show your answer to four decimal places.)arrow_forwardcalculate the mean and ss for each of the following sample numbers 1,3,4,0arrow_forwardConsider the following sample data: 6, 10, 4, 3, 7, 9, 21, and 14. What is the variance? Select one: a. 34.79 b. 33.56 c. 34.21 d. 34.02arrow_forward
- Calculate the range, variance and standard deviation for the following sample data. Scores: 10, 7, 9, 1, 2, 0, 6arrow_forwardWhat is the value of SS (sum of squared deviations) for the following sample? Sample: 1, 1, 1, 7arrow_forward3. What is the sample mean for the following sample of scores? Scores: 1, 2, 5, 4arrow_forward
arrow_back_ios
SEE MORE QUESTIONS
arrow_forward_ios
Recommended textbooks for you
- MATLAB: An Introduction with ApplicationsStatisticsISBN:9781119256830Author:Amos GilatPublisher:John Wiley & Sons Inc
 Probability and Statistics for Engineering and th...StatisticsISBN:9781305251809Author:Jay L. DevorePublisher:Cengage Learning
 Statistics for The Behavioral Sciences (MindTap C...StatisticsISBN:9781305504912Author:Frederick J Gravetter, Larry B. WallnauPublisher:Cengage Learning
  Elementary Statistics: Picturing the World (7th E...StatisticsISBN:9780134683416Author:Ron Larson, Betsy FarberPublisher:PEARSON
 The Basic Practice of StatisticsStatisticsISBN:9781319042578Author:David S. Moore, William I. Notz, Michael A. FlignerPublisher:W. H. Freeman
 Introduction to the Practice of StatisticsStatisticsISBN:9781319013387Author:David S. Moore, George P. McCabe, Bruce A. CraigPublisher:W. H. Freeman
MATLAB: An Introduction with Applications
Statistics
ISBN:9781119256830
Author:Amos Gilat
Publisher:John Wiley & Sons Inc
Probability and Statistics for Engineering and th...
Statistics
ISBN:9781305251809
Author:Jay L. Devore
Publisher:Cengage Learning
Statistics for The Behavioral Sciences (MindTap C...
Statistics
ISBN:9781305504912
Author:Frederick J Gravetter, Larry B. Wallnau
Publisher:Cengage Learning
Elementary Statistics: Picturing the World (7th E...
Statistics
ISBN:9780134683416
Author:Ron Larson, Betsy Farber
Publisher:PEARSON
The Basic Practice of Statistics
Statistics
ISBN:9781319042578
Author:David S. Moore, William I. Notz, Michael A. Fligner
Publisher:W. H. Freeman
Introduction to the Practice of Statistics
Statistics
ISBN:9781319013387
Author:David S. Moore, George P. McCabe, Bruce A. Craig
Publisher:W. H. Freeman