
MATLAB: An Introduction with Applications
6th Edition
ISBN: 9781119256830
Author: Amos Gilat
Publisher: John Wiley & Sons Inc
expand_more
expand_more
format_list_bulleted
Related questions
Question
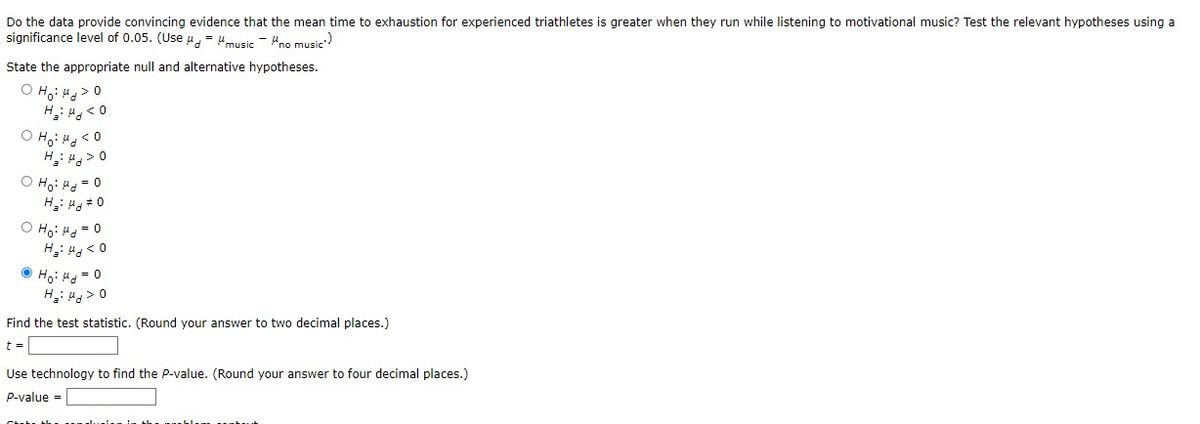

Transcribed Image Text:Do the data provide convincing evidence that the mean time to exhaustion for experienced triathletes is greater when they run while listening to motivational music? Test the relevant hypotheses using a
significance level of 0.05. (Use #music "no music)
State the appropriate null and alternative hypotheses.
OHH O
H₂H<0
ононасо
H₂>O
O Ho: d=0
H₂: Hd O
O Ho: Hd = 0
H₂H<0
ⒸH₂: Hd=0
H₂: Hd>0
Find the test statistic. (Round your answer to two decimal places.)
t =
Use technology to find the P-value. (Round your answer to four decimal places.)
P-value =

Transcribed Image Text:Many
runners believe that listening to music while running enhances their performance. The authors of a paper wondered if this is true for experienced runners. They recorded time to exhaustion for
11 triathletes while running on a treadmill at a speed determined to be near their peak running velocity. The time to exhaustion was recorded for each participant on two different days. On one day, each
participant ran while listening to music that the runner selected as motivational. On a different day, each participant ran with no music playing.
You can assume that it is reasonable to regard these 11 triathletes as representative of the population of experienced triathletes. Only summary quantities were given in the paper, but the data in the table
below are consistent with the means and standard deviations given in the paper.
Time to exhaustion (in seconds)
Motivational
music
Runner
1
3
4
5
6
7
8
9
10
11
535
534
527
521
432
498
555
399
536
543
524
No music
467
449
483
574
563
593
474
499
553
500
521
Expert Solution
This question has been solved!
Explore an expertly crafted, step-by-step solution for a thorough understanding of key concepts.

This is a popular solution

Trending nowThis is a popular solution!

Step by stepSolved in 4 steps with 2 images

Knowledge Booster

Similar questions
- help solve attached What is the conclusion for this test? The p value is greater than or less than the significance level α, so reject or fail to reject the null hypothesis. There is sufficent or insufficent evidence to support the claim that vinyl gloves have a greater virus leak rate than latex gloves.arrow_forwardPlease answer FULL questionarrow_forwardRecently, a large academic medical center determined that 13 of 20 employees in a particular position were female, whereas 41% of the employees for this position in the general workforce were female. At the 0.01 level of significance, is there evidence that the proportion of females in this position at this medical center is different from what would be expected in the general workforce? Question content area bottom Part 1 What are the correct hypotheses to test to determine if the proportion is different? A. H0: π≤0.41; H1: π>0.41 B. H0: π≥0.41; H1: π<0.41 C. H0: π=0.41; H1: π≠0.41 D. H0: π≠0.41; H1: π=0.41 Part 2 Calculate the test statistic. ZSTAT=enter your response here (Type an integer or a decimal. Round to two decimal places as needed.) Part 3 What is the p-value? The p-value is enter your response here. (Type an integer or a decimal. Round to three decimal places as needed.) Part 4 State…arrow_forward
- A December 2014 Pew Research Center poll asked a sample of 1507 adults whether they thought it was important to control gun ownership. A total of 693 of the poll respondents were in support of controls on gun ownership. (a) It the past it was believed that p = 0.48. Test this claim at the a = 0.05 level of significance. Ho: HA: Test Statistic: p-value: Conclusion:arrow_forwardK L Marrow_forwardPlease answer thoroughly. Thank you!arrow_forward
- A published report claims that 35% of college students have used an online dating site or app. Believing this claimed value is too low, a researcher surveys a random sample of n = 420 college students about their experiences with online dating sites and apps. A total of 166 of the surveyed students indicate that they have used online dating sites or apps. Use this information to conduct a hypothesis test at a significance (or alpha) level of 0.05. 1.Based on the test statistic you computed to answer Question 11, along with what you see in Table B, what should the P-value be? 2. Based on the P-value you obtained and how it compares to the significance level of 0.05, what is your conclusion? 3. Look again at your answer to Question 13. If a smaller significance level had been chosen—like 0.01—would you have reached a different conclusion? Please explain. 4. Again, look back at how you answered Question 13. If a larger significance level had been chosen—like 0.10—would you have…arrow_forwardSalma claimed that the gas price in Blue Park neighborhood (mean of $3.65) is higher than that in Green Spring (mean of $3.59). She obtained the t-value of 2.223 after calculating data from 6 gas stations in Blue Park and 5 gas stations in Green Spring. Use the chart below and determine if Salma's claim is supported! Table 10-3. Critical values of "t" significance level p= 0.05 significance level p= 0.01 TP 1 12.706 63.657 2 4.303 9.925 3 3.182 5.841 2.776 4.604 5 2.571 4.032 6 2.447 3.707 7 2.365 3.499 2.306 3.355 9 2.262 3.250 10 2.228 3.169 11 2.201 3.106 Copy the following into your text box, fill in the blanks, and answer the questions A. The degree of freedom is: B. The t-calculated value is: and the t-critical value is : C. Comparison: t-calc t-crit (answer with ()) D. Is the null hypothesis accepted or rejected? Explain how you determined that! Also, explain what it means to reject or accept the hypothesis! E. Explain if Salma's claim is supported based on your t-value…arrow_forwardThe summary statistics are n=85, x=3.93, s=0.63. Use a 0.01 significance level to test the claim that the population of student course evaluations has a mean equal to 4.00. identify null/ alt hypothesis, test statistic, P- value, and state final conclusion that addresses the original claimarrow_forward
arrow_back_ios
arrow_forward_ios
Recommended textbooks for you
- MATLAB: An Introduction with ApplicationsStatisticsISBN:9781119256830Author:Amos GilatPublisher:John Wiley & Sons Inc
 Probability and Statistics for Engineering and th...StatisticsISBN:9781305251809Author:Jay L. DevorePublisher:Cengage Learning
 Statistics for The Behavioral Sciences (MindTap C...StatisticsISBN:9781305504912Author:Frederick J Gravetter, Larry B. WallnauPublisher:Cengage Learning
  Elementary Statistics: Picturing the World (7th E...StatisticsISBN:9780134683416Author:Ron Larson, Betsy FarberPublisher:PEARSON
 The Basic Practice of StatisticsStatisticsISBN:9781319042578Author:David S. Moore, William I. Notz, Michael A. FlignerPublisher:W. H. Freeman
 Introduction to the Practice of StatisticsStatisticsISBN:9781319013387Author:David S. Moore, George P. McCabe, Bruce A. CraigPublisher:W. H. Freeman
MATLAB: An Introduction with Applications
Statistics
ISBN:9781119256830
Author:Amos Gilat
Publisher:John Wiley & Sons Inc
Probability and Statistics for Engineering and th...
Statistics
ISBN:9781305251809
Author:Jay L. Devore
Publisher:Cengage Learning
Statistics for The Behavioral Sciences (MindTap C...
Statistics
ISBN:9781305504912
Author:Frederick J Gravetter, Larry B. Wallnau
Publisher:Cengage Learning
Elementary Statistics: Picturing the World (7th E...
Statistics
ISBN:9780134683416
Author:Ron Larson, Betsy Farber
Publisher:PEARSON
The Basic Practice of Statistics
Statistics
ISBN:9781319042578
Author:David S. Moore, William I. Notz, Michael A. Fligner
Publisher:W. H. Freeman
Introduction to the Practice of Statistics
Statistics
ISBN:9781319013387
Author:David S. Moore, George P. McCabe, Bruce A. Craig
Publisher:W. H. Freeman