
Algebra and Trigonometry (6th Edition)
6th Edition
ISBN: 9780134463216
Author: Robert F. Blitzer
Publisher: PEARSON
expand_more
expand_more
format_list_bulleted
Related questions
Question
Hello! Can you please help me with this? I don't understand
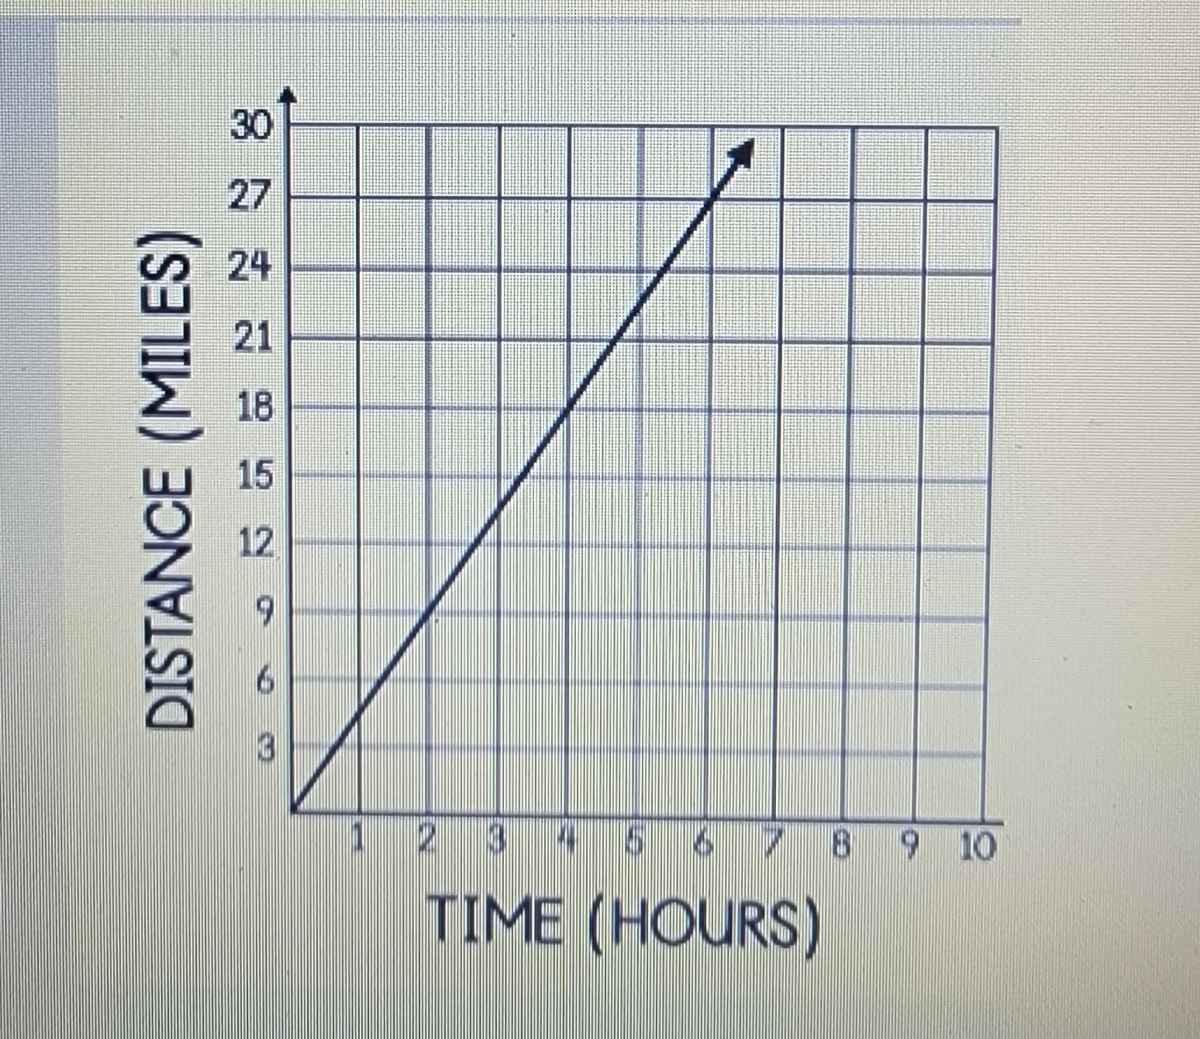

Transcribed Image Text:The graph depicted is a line graph showing the relationship between time and distance. The horizontal axis is labeled "TIME (HOURS)" and ranges from 0 to 10 hours. The vertical axis is labeled "DISTANCE (MILES)" and ranges from 0 to 30 miles.
The line on the graph demonstrates a linear relationship, starting from the origin (0,0) and extending to the point (6, 27). This indicates a constant rate of travel, with the distance increasing proportionally with time. The slope of the line represents the speed, which can be calculated as the change in distance over the change in time.
Key observations:
- At 1 hour, the distance is approximately 4.5 miles.
- At 3 hours, the distance is approximately 13.5 miles.
- At 6 hours, the distance reaches 27 miles.
This graph is useful for understanding concepts of linear motion, uniform speed, and the relationship between time and distance.

Transcribed Image Text:**Text:**
"Find the rate of change demonstrated in the graph."
**Description for Educational Website:**
This sentence prompts students to analyze a graph to determine the rate at which a particular variable changes over time or in relation to another variable.
**Graph/Diagram Explanation:**
- **Axes Labels**: Typically, the x-axis represents the independent variable (such as time), while the y-axis represents the dependent variable (such as distance).
- **Slope**: The rate of change is often determined by calculating the slope of the line in a linear graph. The slope is calculated by dividing the change in the y-value by the change in the x-value between two points on the line.
- **Non-linear Graphs**: If the graph is non-linear, the rate of change may vary at different points, and students may need to calculate the instantaneous rate of change at a specific point using calculus concepts.
This exercise helps in understanding how to interpret and analyze data from graphs, which is a critical skill in fields such as mathematics, science, and economics.
Expert Solution
arrow_forward
Step 1
Use rate of change concept

Step by stepSolved in 2 steps with 1 images

Knowledge Booster

Similar questions
arrow_back_ios
arrow_forward_ios
Recommended textbooks for you
- Algebra and Trigonometry (6th Edition)AlgebraISBN:9780134463216Author:Robert F. BlitzerPublisher:PEARSON
 Contemporary Abstract AlgebraAlgebraISBN:9781305657960Author:Joseph GallianPublisher:Cengage Learning
 Linear Algebra: A Modern IntroductionAlgebraISBN:9781285463247Author:David PoolePublisher:Cengage Learning
  Algebra And Trigonometry (11th Edition)AlgebraISBN:9780135163078Author:Michael SullivanPublisher:PEARSON
 Introduction to Linear Algebra, Fifth EditionAlgebraISBN:9780980232776Author:Gilbert StrangPublisher:Wellesley-Cambridge Press
 College Algebra (Collegiate Math)AlgebraISBN:9780077836344Author:Julie Miller, Donna GerkenPublisher:McGraw-Hill Education
Algebra and Trigonometry (6th Edition)
Algebra
ISBN:9780134463216
Author:Robert F. Blitzer
Publisher:PEARSON
Contemporary Abstract Algebra
Algebra
ISBN:9781305657960
Author:Joseph Gallian
Publisher:Cengage Learning
Linear Algebra: A Modern Introduction
Algebra
ISBN:9781285463247
Author:David Poole
Publisher:Cengage Learning
Algebra And Trigonometry (11th Edition)
Algebra
ISBN:9780135163078
Author:Michael Sullivan
Publisher:PEARSON
Introduction to Linear Algebra, Fifth Edition
Algebra
ISBN:9780980232776
Author:Gilbert Strang
Publisher:Wellesley-Cambridge Press
College Algebra (Collegiate Math)
Algebra
ISBN:9780077836344
Author:Julie Miller, Donna Gerken
Publisher:McGraw-Hill Education