
MATLAB: An Introduction with Applications
6th Edition
ISBN: 9781119256830
Author: Amos Gilat
Publisher: John Wiley & Sons Inc
expand_more
expand_more
format_list_bulleted
Related questions
Concept explainers
Question
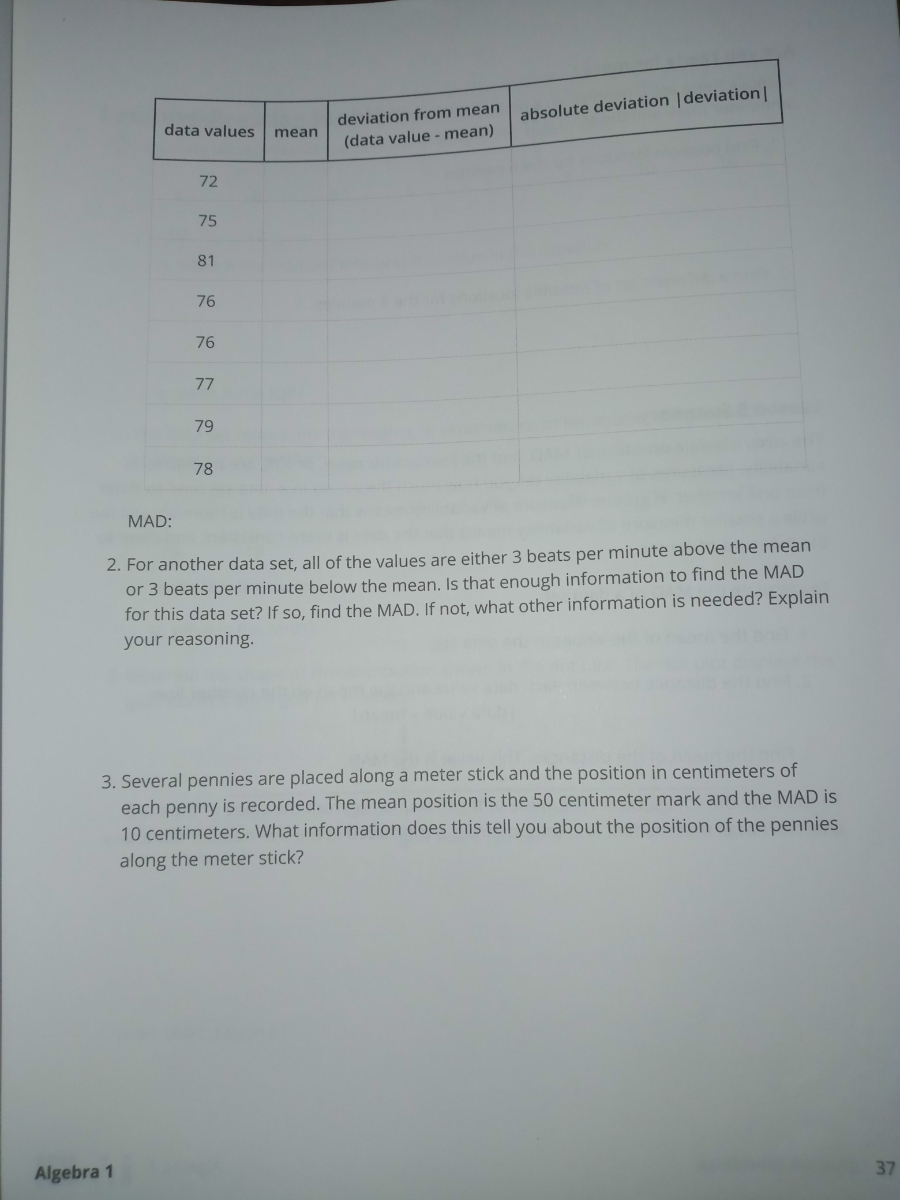

Transcribed Image Text:deviation from mean
absolute deviation |deviation|
data values
mean
(data value - mean)
72
75
81
76
76
77
79
78
MAD:
2. For another data set, all of the values are either 3 beats per minute above the mean
or 3 beats per minute below the mean. Is that enough information to find the MAD
for this data set? If so, find the MAD. If not, what other information is needed? Explain
your reasoning.
3. Several pennies are placed along a meter stick and the position in centimeters of
each penny is recorded. The mean position is the 50 centimeter mark and the MAD is
10 centimeters. What information does this tell you about the position of the pennies
along the meter stick?
Algebra 1
37

Transcribed Image Text:5.2: Heartbeats: Part 1
77
79
76
78
76
81
75
72
1. What is the interquartile range?
2. How many values in the data set are:
a. less than Q1?
b. between Q1 and the median?
c. between the median and Q3?
d. greater than Q3?
the length of dolphins in this pod?
this tell you about the number of correct responses for students taking this tesa
5.3: Heartbeats: Part 2
1. Calculate the MAD using the same data from the previous activity by finding the
average distance from each data value to the mean. You may find it helpful to
organize your work by completing the table provided.
Expert Solution
This question has been solved!
Explore an expertly crafted, step-by-step solution for a thorough understanding of key concepts.

This is a popular solution

Trending nowThis is a popular solution!

Step by stepSolved in 2 steps

Knowledge Booster


Learn more about
Need a deep-dive on the concept behind this application? Look no further. Learn more about this topic, statistics and related others by exploring similar questions and additional content below.Similar questions
- The data set represents the number of errors on a typing test what is the median tell me what this value means in this situation what is the IQRarrow_forwardDiameter (cm) Area (cm?) 2 3 4 13 6 28 10 79 16 201 20 314 26. Describe the general trend of the data.arrow_forwardFind the mean of the data summarized in the given frequency distribution. Compare the computed mean to the actual mean of 56.6 degrees. Low Temperature (F) Frequency 40-44 45-49 50-54 55-59 60-64 1 6 11 5 1 The mean of the frequency distribution is (Round to the nearest tenth as needed.) iew an example Get more help. degrees. ... Clear all Check answer Us orrectarrow_forward
- True/False Write T or F in the blank to indicate whether the statement is true or false. A statistic is a piece of data that describes an entire population. When constructing a histogram, the bars should touch each other. The standard deviation is equal to the largest data point minus the smallest data point. The Greek letter µ represents the mean value of the data for a population. If the data is skewed, the best measure of average is the median as opposed to the mean. Qualitative data cannot be displayed via a pie chart. The median is the point at which 50% of the data are smaller and 50% of the data are larger. When r = -1, that means there is no corelation between the two variables. The number of points scored in a baseball game is a discrete piece of data. If variable y always increases whenever variable x increases, the only possibility is that x causes y.arrow_forwardWhat is the median of this set of dataarrow_forwardUsing the stemplot of annual precipitation (inches) below, determine the range, IQR, variance and standard deviation. Please answer correctly.arrow_forward
- Find the area of the shaded region. The graph to the right depicts IQ scores of adults, and those scores are normally distributed with a mean of 100 and a standard deviation of 15. Click to view page 1 of the table. LOADING... Click to view page 2 of the table. LOADING... 85 110 A graph with a bell-shaped curve, divided into 3 regions by 2 lines from top to bottom, one on the left side and one on the right side. The region between the lines is shaded. Moving from left to right, the x-axis below the first line is labeled 85. The x-axis below the second line is labeled 110. Question content area bottom Part 1 The area of the shaded region is enter your response here. (Round to four decimal places as needed.)arrow_forwardZOOM + 2. Researchers studying acid rain recorded the pH level for a sample of 26 water sources in Pennsylvania. The sorted list of the data (some values have been obscured), the histogram of the data, and some other statistics are below. Histogram of pH levels Sort (pH) Frequency 10 10- 4.12 4.12 ?? ?? 4.29 ?? 4.31 4.39 4.39 4.40 4.41 4.45 4.52 4.56 4.57 4.60 ?? ?? 4.73 ?? 5.08 5.29 5.51 5.62 5.67 5.78 Summary statistics: Col n Min Max Q1 pH Q3 26 4.12 5.78 4.31 4.82 a) Find the median pH level. Carefully show your work. b) Considering your answer to part a) and the histogram, which would be the best choice for the sample mean pH level (4.68, 4.56, or 4.00 units)? Explain. c) Find the Range of the pH levels. d) Find the IQR of the pH levels 1 pH 3. The following numbers are a sample of ten of my golf scores from 2020. In golf the “units" are technically called "strokes". Find my mean score and the standard deviation of my scores. 98, 94, 88, 90, 86, 92, 86, 85, 84, 87arrow_forwardThe box plots below represent the math test scores of Amy and Ed for the spring semester Amy Ed • 68 70 72 74 76 78 80 82 84 86 88 90 92 Which student has the greater median test score? Which student has the greater interquartile range of test scores? Which student has the greater range of test scores? Page 9:26 AM 4/26/2021 TIME OUTarrow_forward
- Need help with my math homeworkarrow_forwardData Set: 3,7, 11, 13, 16 The mean of this data set is The summation of the squares of the difference from the mean is 104. The standard deviation is the square root of the summation divided by the sample size. The Standard Deviation is rounded to 2 decimal positions.arrow_forwardSolve and show work.arrow_forward
arrow_back_ios
SEE MORE QUESTIONS
arrow_forward_ios
Recommended textbooks for you
- MATLAB: An Introduction with ApplicationsStatisticsISBN:9781119256830Author:Amos GilatPublisher:John Wiley & Sons Inc
 Probability and Statistics for Engineering and th...StatisticsISBN:9781305251809Author:Jay L. DevorePublisher:Cengage Learning
 Statistics for The Behavioral Sciences (MindTap C...StatisticsISBN:9781305504912Author:Frederick J Gravetter, Larry B. WallnauPublisher:Cengage Learning
  Elementary Statistics: Picturing the World (7th E...StatisticsISBN:9780134683416Author:Ron Larson, Betsy FarberPublisher:PEARSON
 The Basic Practice of StatisticsStatisticsISBN:9781319042578Author:David S. Moore, William I. Notz, Michael A. FlignerPublisher:W. H. Freeman
 Introduction to the Practice of StatisticsStatisticsISBN:9781319013387Author:David S. Moore, George P. McCabe, Bruce A. CraigPublisher:W. H. Freeman
MATLAB: An Introduction with Applications
Statistics
ISBN:9781119256830
Author:Amos Gilat
Publisher:John Wiley & Sons Inc
Probability and Statistics for Engineering and th...
Statistics
ISBN:9781305251809
Author:Jay L. Devore
Publisher:Cengage Learning
Statistics for The Behavioral Sciences (MindTap C...
Statistics
ISBN:9781305504912
Author:Frederick J Gravetter, Larry B. Wallnau
Publisher:Cengage Learning
Elementary Statistics: Picturing the World (7th E...
Statistics
ISBN:9780134683416
Author:Ron Larson, Betsy Farber
Publisher:PEARSON
The Basic Practice of Statistics
Statistics
ISBN:9781319042578
Author:David S. Moore, William I. Notz, Michael A. Fligner
Publisher:W. H. Freeman
Introduction to the Practice of Statistics
Statistics
ISBN:9781319013387
Author:David S. Moore, George P. McCabe, Bruce A. Craig
Publisher:W. H. Freeman