
MATLAB: An Introduction with Applications
6th Edition
ISBN: 9781119256830
Author: Amos Gilat
Publisher: John Wiley & Sons Inc
expand_more
expand_more
format_list_bulleted
Related questions
Concept explainers
Question
Determine the equation for the line of best fit for this data set and its
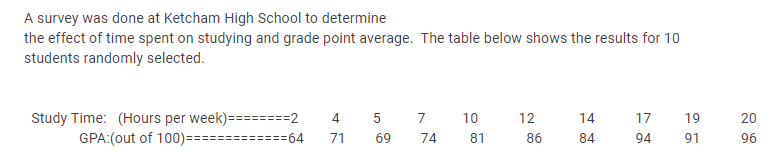

Transcribed Image Text:A survey was done at Ketcham High School to determine
the effect of time spent on studying and grade point average. The table below shows the results for 10
students randomly selected.
Study Time: (Hours per week)========2
GPA:(out of 100)======
4 5
7
10
12
14
17
19
20
==64
71
69
74
81
86
84
94
91
96
Expert Solution
This question has been solved!
Explore an expertly crafted, step-by-step solution for a thorough understanding of key concepts.

This is a popular solution

Trending nowThis is a popular solution!

Step by stepSolved in 2 steps with 2 images

Knowledge Booster


Learn more about
Need a deep-dive on the concept behind this application? Look no further. Learn more about this topic, statistics and related others by exploring similar questions and additional content below.Similar questions
- The relationship between the cost of a concert ticket and a ranking of the performer's popularity was summarized by a regression equation with slope of 135 and y-intercept of -373. What is the equation of the regression line? cost =+ (O popularity Enter your answer in each of the answer boxes. tv 12 MacBook Air DD 888 esc F7 F8 F9 F5 F6 F1 F2 F3 F4arrow_forwardWhat is the value of the y-intercept? what is the meaning of the meaning of the y-intercept?arrow_forwardPlease answer A, B, D, F & G. Thank you!!arrow_forward
- a) Determine a linear regression equation for the data. Round the slope and y-intercept to the nearest whole number. b) Find the correlation coefficient, r-value, of the line. Round your answer to the nearest thousandth. c) Predict the distance the driver would have traveled after 11 hours. Round your answer to the nearest whole number.arrow_forwardRefer to the data in the table: x y -3 0 -2 0 -1 1 0 1 1 3 2 4 Part a: Make a scatter plot and determine which type of model best fits the data. Part b: Find the regression equation. Part c: Use the equation from Part b to determine y when x = 25.arrow_forwardThe accompanying data are the number of wins and the earned run averages (mean number of earned runs allowed per nine innings pitched) for eight baseball pitchers in a recent season. Find the equation of the regression line. Then construct a scatter plot of the data and draw the regression line. Then use the regression equation to predict the value of y for each of the given x-values, if meaningful. If the x-value is not meaningful to predict the value of y, explain why not. (a) x = 5 wins (b) x = 10 wins (c) x = 19 wins (d) x = 15 wins E Click the icon to view the table of numbers of wins and earned run average. The equation of the regression line is y =x+ (Round to two decimal places as needed.) Construct a scatter plot of the data and draw the regression line. Choose the correct graph below. OA. OB. OC. OD. AERA 6- AERA AERA AERA 2- 2- 2- 0- 0- 12 18 24 12 18 24 12 18 24 12 18 24 Wins Wins Wins Wins (a) Predict the ERA for 5 wins, if it is meaningful. Select the correct choice below…arrow_forward
- The accompanying data are the number of wins and the earned run averages (mean number of earned runs allowed per nine innings pitched) for eight baseball pitchers in a recent season. Find the equation of the regression line. Then construct a scatter plot of the data and draw the regression line. Then use the regression equation to predict the value of y for each of the given x-values, if meaningful. If the x-value is not meaningful to predict the value of y, explain why not. (a) x = 5 wins (b) x = 10 wins (c) x = 19 wins (d) x = 15 wins Click the icon to view the table of numbers of wins and earned run average. The equation of the regression line is y = x+. (Round to two decimal places as needed.)arrow_forwardplease assist, the question states to "click on the datafile logo to reference the data" but the data is listed already in the question. when clicking that link, it opens up the same information in excel so please do not reject because the data is there already.arrow_forwardThe accompanying data are the number of wins and the earned run averages (mean number of earned runs allowed per nine innings pitched) for eight baseball pitchers in a recent season. Find the equation of the regression line. Then construct a scatter plot of the data and draw the regression line. Then use the regression equation to predict the value of y for each of the given x-values, if meaningful. If the x-value is not meaningful to predict the value of y, explain why not. (a) x = 5 wins (c) x = 19 wins (d) x = 15 wins (b)x= 10 wins Click the icon to view the table of numbers of wins and earned run average. .. The equation of the regression line is y=x+ X+ (Round to two decimal places as needed.) Construct a scatter plot of the data and draw the regression line. Choose the correct graph below. OA. B. O C. O D. AERA AERA 6+ Q AERA 6+ 4- 4- 2- 2- 0- 6 12 18 24 0 12 18 24 6 12 18 24 Wins 12 18 24 Wins Wins Wins (a) Predict the ERA for 5 wins, if it is meaningful. Select the correct…arrow_forward
- The chart below shows the correlation between degrees Fahrenheit and degrees Celsius. Part a: Make a scatter plot and determine which type of model best fits the data.Part b: Find the regression equation.Part c: Use the equation from Part b to determine ºC when ºF = 47.Part d: Does this answer seem reasonable? Explain.arrow_forwardDefine the different ways to use linear regression?arrow_forwardPart a: Make a scatter plot and determine which type of model best fits the data.Part b: Find the regression equation.Part c: Use the equation from Part b to determine y when x = 7.arrow_forward
arrow_back_ios
SEE MORE QUESTIONS
arrow_forward_ios
Recommended textbooks for you
- MATLAB: An Introduction with ApplicationsStatisticsISBN:9781119256830Author:Amos GilatPublisher:John Wiley & Sons Inc
 Probability and Statistics for Engineering and th...StatisticsISBN:9781305251809Author:Jay L. DevorePublisher:Cengage Learning
 Statistics for The Behavioral Sciences (MindTap C...StatisticsISBN:9781305504912Author:Frederick J Gravetter, Larry B. WallnauPublisher:Cengage Learning
  Elementary Statistics: Picturing the World (7th E...StatisticsISBN:9780134683416Author:Ron Larson, Betsy FarberPublisher:PEARSON
 The Basic Practice of StatisticsStatisticsISBN:9781319042578Author:David S. Moore, William I. Notz, Michael A. FlignerPublisher:W. H. Freeman
 Introduction to the Practice of StatisticsStatisticsISBN:9781319013387Author:David S. Moore, George P. McCabe, Bruce A. CraigPublisher:W. H. Freeman
MATLAB: An Introduction with Applications
Statistics
ISBN:9781119256830
Author:Amos Gilat
Publisher:John Wiley & Sons Inc
Probability and Statistics for Engineering and th...
Statistics
ISBN:9781305251809
Author:Jay L. Devore
Publisher:Cengage Learning
Statistics for The Behavioral Sciences (MindTap C...
Statistics
ISBN:9781305504912
Author:Frederick J Gravetter, Larry B. Wallnau
Publisher:Cengage Learning
Elementary Statistics: Picturing the World (7th E...
Statistics
ISBN:9780134683416
Author:Ron Larson, Betsy Farber
Publisher:PEARSON
The Basic Practice of Statistics
Statistics
ISBN:9781319042578
Author:David S. Moore, William I. Notz, Michael A. Fligner
Publisher:W. H. Freeman
Introduction to the Practice of Statistics
Statistics
ISBN:9781319013387
Author:David S. Moore, George P. McCabe, Bruce A. Craig
Publisher:W. H. Freeman