MATLAB: An Introduction with Applications
6th Edition
ISBN: 9781119256830
Author: Amos Gilat
Publisher: John Wiley & Sons Inc
expand_more
expand_more
format_list_bulleted
Question

Transcribed Image Text:@
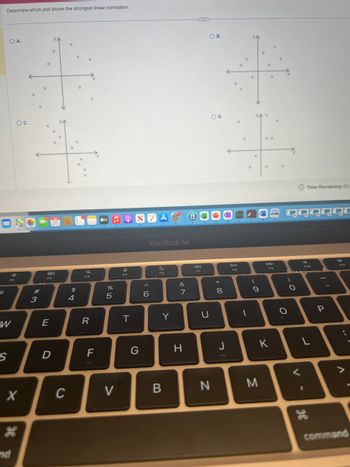
Determine which plot shows the strongest linear correlation.
O A.
S
F2
W
O C.
X
nd
#3
O
E
26
80
F3
D
C
$
4
0
F4
R
F
%
5
JO
V
F5
T
SZA
G
MacBook Air
6
Fo
Y
B
&
M
7
H
6
C
F7
OB.
U
N
O D.
* 00
8
J
DII
FB
1
0
O
0
(
9
M
O
00
K
0
0
O
qqqqq
O
O
Time Remaining: 00:
F10
L
I
P
-
^
command
Expert Solution
This question has been solved!
Explore an expertly crafted, step-by-step solution for a thorough understanding of key concepts.
This is a popular solution
Trending nowThis is a popular solution!
Step by stepSolved in 3 steps

Knowledge Booster
Similar questions
- Distinguish the correlation shown in the graph below. Summarize why it is the chosen correlation. 30 Use the paperclip button below to attach files. Student can enter max 3000 characters 1- XD 2= DELL to B I U 25 de 2arrow_forwardWhat kind of relationship is depicted in the following graph? 7 2 1 0 2 3 a. A positive linear correlation b. A nonlinear correlation c. No correlation Od. A negative linear correlation 6 9 10arrow_forwardMake a scatter diagram for the data. Use the scatter diagram to describe how, if at all, the variables are related. Subject A B C D EF G Time watching TV, x 8 4 2 7 756 Time on Internet, y 9 7 3 12 13 4 13 O A. The variables appear to be negatively, linearly related. 20- X 20 O B. The variables appear to be positively, linearly related. 20- X 20 N C. The variables do not appear to be linearly related. 20- 0 20 N D. The variables do not appear to be linearly related. 20- 0 X 20arrow_forward
- Which scatter plot shown has a correlation coefficient, r, closest to 0?arrow_forwardPlease help with these questions.arrow_forwardGive an example of two variables that have a positive linear correlation. Give an example of two variables that have a negative linear correlation. Give an example of two variables that have no correlation. Below is the height in inches and weight in pounds of eleven individuals Height, x 62 63 66 68 70 72 73 74 74 75 75 Weight, y 195 190 250 220 250 255 260 275 280 295 300 x = 65 inches x = 69 inches x = 71 inchesarrow_forward
- Fill in the blank. A A Jhy trial exists between two variables when the values of one variable are somehow associated with the values of the other variable. exists between two variables when the values of one variable are somehow associated with the values of the other variable. correlation inference differencearrow_forwardPlease explain if it's a negative linear or positive linear or no linear correlation at all.arrow_forwardPlease helparrow_forward
- + Automatic Zoom Weight (tons) 70 60 50 40 30 ROSA200 16, 17, 10 20 40 60 80 100 Length (feet) X4 Which statement accurately describes the information in the scatter plot? A. The information shows a positive correlation. The weight of a dinosaur tends to increase according to its length. B. The information shows a negative correlation. The weight of a dinosaur tends to decrease according to its length. C. The information shows no correlation. The weight and length vary according to the type of dinosaur. D. The information shows no correlation. The relationship between the weight and length of a dinosaur is uncertain. Book Page 182-183arrow_forwardfind t reject or fail to rejectarrow_forward◄ Calculate r for the set of data using any technology of your choice. Round values to the nearest hundredth. Interpret r, what type of correlation, if any, does the data have? Does the data show a positive or negative association? X y 1 5 1.5 4.5 2 0.6 2.2 3.3 3.8 3.5 3 2.8arrow_forward
arrow_back_ios
arrow_forward_ios
Recommended textbooks for you
 MATLAB: An Introduction with ApplicationsStatisticsISBN:9781119256830Author:Amos GilatPublisher:John Wiley & Sons Inc
 Probability and Statistics for Engineering and th...StatisticsISBN:9781305251809Author:Jay L. DevorePublisher:Cengage Learning
 Statistics for The Behavioral Sciences (MindTap C...StatisticsISBN:9781305504912Author:Frederick J Gravetter, Larry B. WallnauPublisher:Cengage Learning
 Elementary Statistics: Picturing the World (7th E...StatisticsISBN:9780134683416Author:Ron Larson, Betsy FarberPublisher:PEARSON
 The Basic Practice of StatisticsStatisticsISBN:9781319042578Author:David S. Moore, William I. Notz, Michael A. FlignerPublisher:W. H. Freeman
 Introduction to the Practice of StatisticsStatisticsISBN:9781319013387Author:David S. Moore, George P. McCabe, Bruce A. CraigPublisher:W. H. Freeman

MATLAB: An Introduction with Applications
Statistics
ISBN:9781119256830
Author:Amos Gilat
Publisher:John Wiley & Sons Inc

Probability and Statistics for Engineering and th...
Statistics
ISBN:9781305251809
Author:Jay L. Devore
Publisher:Cengage Learning

Statistics for The Behavioral Sciences (MindTap C...
Statistics
ISBN:9781305504912
Author:Frederick J Gravetter, Larry B. Wallnau
Publisher:Cengage Learning

Elementary Statistics: Picturing the World (7th E...
Statistics
ISBN:9780134683416
Author:Ron Larson, Betsy Farber
Publisher:PEARSON

The Basic Practice of Statistics
Statistics
ISBN:9781319042578
Author:David S. Moore, William I. Notz, Michael A. Fligner
Publisher:W. H. Freeman

Introduction to the Practice of Statistics
Statistics
ISBN:9781319013387
Author:David S. Moore, George P. McCabe, Bruce A. Craig
Publisher:W. H. Freeman