
MATLAB: An Introduction with Applications
6th Edition
ISBN: 9781119256830
Author: Amos Gilat
Publisher: John Wiley & Sons Inc
expand_more
expand_more
format_list_bulleted
Related questions
Concept explainers
Topic Video
Question
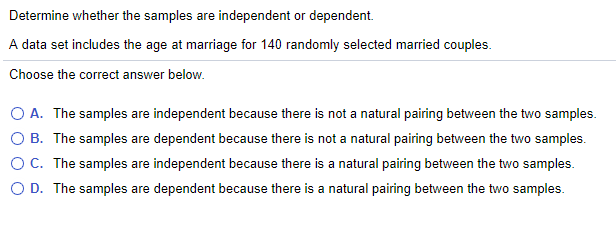

Transcribed Image Text:**Determine whether the samples are independent or dependent.**
A data set includes the age at marriage for 140 randomly selected married couples.
Choose the correct answer below.
- A. The samples are independent because there is not a natural pairing between the two samples.
- B. The samples are dependent because there is not a natural pairing between the two samples.
- C. The samples are independent because there is a natural pairing between the two samples.
- D. The samples are dependent because there is a natural pairing between the two samples.
Expert Solution
This question has been solved!
Explore an expertly crafted, step-by-step solution for a thorough understanding of key concepts.

This is a popular solution

Trending nowThis is a popular solution!

Step by stepSolved in 2 steps

Knowledge Booster


Learn more about
Need a deep-dive on the concept behind this application? Look no further. Learn more about this topic, statistics and related others by exploring similar questions and additional content below.Similar questions
- 40 The top 20 quarterbacks in the NFL with the most Touchdowns (TD) in the 2020 season were selected The data comes from a normally distributed population. Player TD Aaron Rodgers 48 Russell Wilson Tom Brady 40 38 Patrick Mahomes Josh Allen 37 Kirk Cousins 35 Deshaun Watson 33 Ryan Tannehill 33 Ben Roethlisberger 33 Justin Herbert Derek Carr 27 Matthew Stafford Matt Ryan 26 Kyler Murray Baker Mayfield Lamar Jackson Philip Rivers 24 Drew Brees 24 33,35,37,38, 40ot 40+48 Jared Goff Carson Wentz 1) Data Analysis – Find the following rounding answers to the whole number when necess: Mean: 30 Median: Mode: Midrange: Range: Standard Deviation:arrow_forwardA fundraiser is offering a small gift to people making a donation. The donor can choose one of four gifts: a mug, a t-shirt, a plush toy, or a water bottle. The fundraiser would like to know if any of the gifts were more or less popular or were they equal in preference. The data for n = 40 donors are below:arrow_forwardst the sample space . Use the sample sparrow_forward
- For the three-part question that follows, provide your answer to each question in the given workspace. Identify each part with a coordinating response. Be sure to clearly label each part of your response as Part A, Part B, and Part C.Use the information below for Part A, Part B, and Part C. Every person at the park received a ticket. Of those tickets, only 45 were winning tickets. In a random sample of 25 people, 2 people had winning tickets.Part A: Write a ratio to represent the number of winning tickets to all tickets in the sample population.Part B: Make a reasonable claim or prediction about the population at the park.Part C: Justify your answer to Part B by showing your work.arrow_forwardA survey was taken on course selection and gender. The results are represented in the table below. Вoys Girls TOTAL Band 27 17 44 Team Sports 64 46 110 Neither 13 9 22 ΤΟTAL 104 72 176 What percentage of those surveyed are boys AND taking Team Sports? Round to the nearest percent. % are boys and taking team sports.arrow_forwardWe asked 32 Learners in Mr. Magana’s Class if they have Facebook. 11 males and 7 females answered yes. 8 females answered no. Build a two-way table that shows this data. Fill in any empty spacesarrow_forward
- A survey of a subset of a population is called a? survey of element. target survey. sampled population. sample survey.arrow_forwardGiven a data set, how do you know whether to calculate o or s? Choose the correct answer below. O A. When given a data set, one would have to determine if it represented the population or if it was a sample taken from the population. If the data are a population, then o is calculated. If the data are a sample, then s is calculated. O B. If the given data set contains a large number of entries, then s is calculated. If the data set contains a small number of entries, then o is calculated. O C. If the given data set contains a large number of entries, then o is calculated. If the data set contains a small number of entries, then s is calculated. O D. When given a data set, one would have to determine if it represented the population or if it was a sample taken from the population. If the data are a population, then s is calculated. If the data are a sample, then o is calculated.arrow_forwardA small college has been accused of gender bias in its admissions to graduate programs. a. Out of 500 men who applied, 255 were accepted. Out of 700 women who applied, 240 were accepted. Find the acceptance rate for each gender. Does this suggest bias? b. The college then looked at each of the two departments with graduate programs and found the data below. Compute the acceptance rate within each department by gender. Does this suggest bias? Department Men Women Applied Admitted Applied Admitted Dept A 400 240 100 90 Dept B 100 15 600 150 c. Looking at our results from Parts a and b, what can you conclude? Is there gender bias in this college’s admissions? If so, in which direction?arrow_forward
- complaint and, if so, whether the complaint was medical or nonmedical in nature. After a year, a tally from these patients was collected to count number who left the HMO voluntarily. Here are the data on the total number in each group and the number who voluntarily left the HMO: No complaint Medical complaint Nonmedical complaint Total A certain health maintenance organization (HMO) wishes to study why patients leave the HMO. A SRS of 423 patients was taken. Data was collected on whether a patient had filed a 177 111 135 Left 64 27 50 If the null hypothesis is Ho : pı = P2 = P3 and using a = 0.05, then do the following: (a) Find the expected number of people with no complaint who leave the HMO: (b) Find the expected number of people with a medical complaint who leave the HMO: (c) Find the expected number of people with a nonmedical complaint who leave the HMO: (d) Find the test statistic: (e) Find the degrees of freedom: (f) Find the critical value: (g) The final conclusion is OA. We…arrow_forwardHelp.arrow_forwardA survey was taken on course selection and gender. The results are represented in the table below. Воys Girls ТОТAL Band 27 17 44 Team Sports 64 46 110 Neither 13 22 ТОТAL 104 72 176 What percentage of those surveyed are girls? Round to the nearest percent. % are girls.arrow_forward
arrow_back_ios
SEE MORE QUESTIONS
arrow_forward_ios
Recommended textbooks for you
- MATLAB: An Introduction with ApplicationsStatisticsISBN:9781119256830Author:Amos GilatPublisher:John Wiley & Sons Inc
 Probability and Statistics for Engineering and th...StatisticsISBN:9781305251809Author:Jay L. DevorePublisher:Cengage Learning
 Statistics for The Behavioral Sciences (MindTap C...StatisticsISBN:9781305504912Author:Frederick J Gravetter, Larry B. WallnauPublisher:Cengage Learning
  Elementary Statistics: Picturing the World (7th E...StatisticsISBN:9780134683416Author:Ron Larson, Betsy FarberPublisher:PEARSON
 The Basic Practice of StatisticsStatisticsISBN:9781319042578Author:David S. Moore, William I. Notz, Michael A. FlignerPublisher:W. H. Freeman
 Introduction to the Practice of StatisticsStatisticsISBN:9781319013387Author:David S. Moore, George P. McCabe, Bruce A. CraigPublisher:W. H. Freeman
MATLAB: An Introduction with Applications
Statistics
ISBN:9781119256830
Author:Amos Gilat
Publisher:John Wiley & Sons Inc
Probability and Statistics for Engineering and th...
Statistics
ISBN:9781305251809
Author:Jay L. Devore
Publisher:Cengage Learning
Statistics for The Behavioral Sciences (MindTap C...
Statistics
ISBN:9781305504912
Author:Frederick J Gravetter, Larry B. Wallnau
Publisher:Cengage Learning
Elementary Statistics: Picturing the World (7th E...
Statistics
ISBN:9780134683416
Author:Ron Larson, Betsy Farber
Publisher:PEARSON
The Basic Practice of Statistics
Statistics
ISBN:9781319042578
Author:David S. Moore, William I. Notz, Michael A. Fligner
Publisher:W. H. Freeman
Introduction to the Practice of Statistics
Statistics
ISBN:9781319013387
Author:David S. Moore, George P. McCabe, Bruce A. Craig
Publisher:W. H. Freeman