
MATLAB: An Introduction with Applications
6th Edition
ISBN: 9781119256830
Author: Amos Gilat
Publisher: John Wiley & Sons Inc
expand_more
expand_more
format_list_bulleted
Related questions
Question

Transcribed Image Text:df
0.25
0.20
0.15
0.10
0.05
0.025
0.02
0.01
0.005
0.0025
0.001
0.0005
636.619
31.599
1
1.376
1.963
3.078
6.314
2.920
2.353
12.706
15.894
4.849
3.482
2.999
31.821
63.657
127.321
318.309
22.327
10.215
1.000
0.816
3
0.765
4
0.741
1.886
1.638
1.533
1.476
4.303
3.182
2.776
9.925
5.841
4.604
1.061
0.978
1.386
1.250
1.190
6.965
4.541
3.747
3.365
14.089
7.453
5.598
4.773
12.924
8.610
0.941
2.132
7.173
5
0.727
0.920
1.156
2.015
2.571
2.757
4.032
5.893
6.869
2.447
2.365
2.306
2.262
2.228
4.317
4.029
3.833
3.690
6
0.718
0.906
1.134
1.440
1.943
2.612
3.143
3.707
3.499
3.355
3.250
5.208
4.785
4.501
4.297
5.959
7
0.711
0.896
1.119
1.415 1.895
5.408
2.517
2.449
2.398
2.998
0.889
0.883
2.896
2.821
8
0.706
0.703
0.700
1.108
1.100
1.093
1.397 1.860
1.383
1.833
1.812
1.372
5.041
4.781
10
0.879
2.359
2.764
3.169
3.581
4.144
4.587
0.697
1.796
2.201
3.497
3.428
3.372
3.326
4.025
3.930
3.852
3.787
3.733
11
0.876
1.088
1.083
1.363
1.356
2.328
2.718
3.106
3.055
3.012
2.977
2.947
4.437
0.873
0.870
2.303
2.681
2.650
2.624
2.602
12
0.695
0.694
0.692
1.782
1.771
2.179
4.318
13
14
1.079
1.076
1.350
1.345
1.341
2.160
2.145
2.131
2.282
4.221
0.868
1.761
2.264
4.140
15
0.691
0.866
1.074
1.753
2.249
3.286
4.073
1.337
1.333
1.330
1.328
1.325
3.252
3.222
3.197
3.174
3.153
0.690
1.746
2.120
2.921
4.015
3.965
3.922
3.883
3.850
16
0.689
0.688
0.688
0.687
0.865
0.863
0.862
1.071
1.069
1.067
2.235
2.224
2.583
2.567
2.552
2.898
2.878
2.861
2.845
3.686
3.646
3.610
3.579
3.552
17
1.740
2.110
18
1.734
1.729
2.101
2.214
2.539
2.528
19
0.861
1.066
2.093
2.205
20
0.860
1.064
1.725
2.086
2.197
![Determine the t-value in each of the cases.
Click the icon to view the table of areas under the t-distribution.
.....
(a) Find the t-value such that the area in the right tail is 0.05 with 25 degrees of freedom.
(Round to three decimal places as needed.)
(b) Find the t-value such that the area in the right tail is 0.02 with 12 degrees of freedom.
(Round to three decimal places as needed.)
(c) Find the t-value such that the area left of the t-value is 0.005 with 10 degrees of freedom. [Hint: Use symmetry.]
(Round to three decimal places as needed.)
(d) Find the critical t-value that corresponds to 50% confidence. Assume 17 degrees of freedom.
(Round to three decimal places as needed.)](https://content.bartleby.com/qna-images/question/621c49c6-a897-4840-8c88-322fda0fb090/9c858ad7-e10e-4cfe-b54e-757c8043eedc/fnr4b6k_processed.png)
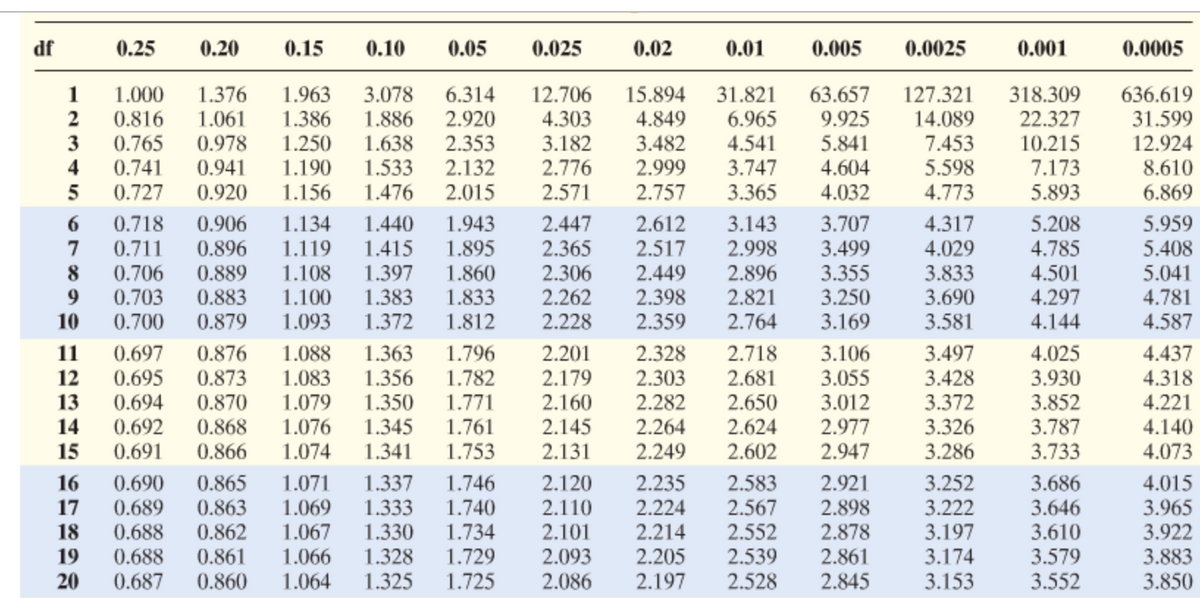
Transcribed Image Text:Determine the t-value in each of the cases.
Click the icon to view the table of areas under the t-distribution.
.....
(a) Find the t-value such that the area in the right tail is 0.05 with 25 degrees of freedom.
(Round to three decimal places as needed.)
(b) Find the t-value such that the area in the right tail is 0.02 with 12 degrees of freedom.
(Round to three decimal places as needed.)
(c) Find the t-value such that the area left of the t-value is 0.005 with 10 degrees of freedom. [Hint: Use symmetry.]
(Round to three decimal places as needed.)
(d) Find the critical t-value that corresponds to 50% confidence. Assume 17 degrees of freedom.
(Round to three decimal places as needed.)
Expert Solution
This question has been solved!
Explore an expertly crafted, step-by-step solution for a thorough understanding of key concepts.

This is a popular solution

Trending nowThis is a popular solution!

Step by stepSolved in 4 steps with 3 images

Knowledge Booster

Similar questions
- Find the area of the shaded region. The graph to the right depicts IQ scores of adults, and those scores are normally distributed with a mean of 100 and a standard deviation of 15. 91 The area of the shaded region is . (Round to four decimal places as needed.)arrow_forwardFind the z-score that has 70.5% of the distribution's area to its right. The z-score is (Round to two decimal places as needed.)arrow_forwardDetermine the t-value in each of the cases. Click the icon to view the table of areas under the t-distribution. (a) Find the t-value such that the area in the right tail is 0.10 with 20 degrees of freedom. (Round to three decimal places as needed.)arrow_forward
- 21 d-farrow_forwardAssume that a randomly selected subject is given a bone density test. Those test scores are normally distributed with a mean of 0 and a standard deviation of 1. Draw a graph and find the probability of a bone density test score greater than -3.71. Sketch the region. Choose the correct graph below. OA. 3.71 Q B. -3.71 The probability of a bone density test score greater than -3.71 is ☐. (Round to four decimal places as needed.) ๘ ๘ ปี OC. OD. Л 3.71 3.71arrow_forwardThe trade volume of a stock is the number of shares traded on a given day. The following data, in millions represent the volume of a certain stock traded for a random sample of 40 trading days in 2007. use the data to compute a point estimate for the population mean number of shares traded per day in 2007. (Round to three decimal places as needed.)arrow_forward
arrow_back_ios
arrow_forward_ios
Recommended textbooks for you
- MATLAB: An Introduction with ApplicationsStatisticsISBN:9781119256830Author:Amos GilatPublisher:John Wiley & Sons Inc
 Probability and Statistics for Engineering and th...StatisticsISBN:9781305251809Author:Jay L. DevorePublisher:Cengage Learning
 Statistics for The Behavioral Sciences (MindTap C...StatisticsISBN:9781305504912Author:Frederick J Gravetter, Larry B. WallnauPublisher:Cengage Learning
  Elementary Statistics: Picturing the World (7th E...StatisticsISBN:9780134683416Author:Ron Larson, Betsy FarberPublisher:PEARSON
 The Basic Practice of StatisticsStatisticsISBN:9781319042578Author:David S. Moore, William I. Notz, Michael A. FlignerPublisher:W. H. Freeman
 Introduction to the Practice of StatisticsStatisticsISBN:9781319013387Author:David S. Moore, George P. McCabe, Bruce A. CraigPublisher:W. H. Freeman
MATLAB: An Introduction with Applications
Statistics
ISBN:9781119256830
Author:Amos Gilat
Publisher:John Wiley & Sons Inc
Probability and Statistics for Engineering and th...
Statistics
ISBN:9781305251809
Author:Jay L. Devore
Publisher:Cengage Learning
Statistics for The Behavioral Sciences (MindTap C...
Statistics
ISBN:9781305504912
Author:Frederick J Gravetter, Larry B. Wallnau
Publisher:Cengage Learning
Elementary Statistics: Picturing the World (7th E...
Statistics
ISBN:9780134683416
Author:Ron Larson, Betsy Farber
Publisher:PEARSON
The Basic Practice of Statistics
Statistics
ISBN:9781319042578
Author:David S. Moore, William I. Notz, Michael A. Fligner
Publisher:W. H. Freeman
Introduction to the Practice of Statistics
Statistics
ISBN:9781319013387
Author:David S. Moore, George P. McCabe, Bruce A. Craig
Publisher:W. H. Freeman