Question
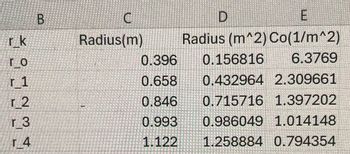
Need help on finding the values of R_k , R_0 and S . If you can show me how to solve it step by step , thanks in advance .

Transcribed Image Text:r_k
B
C
Radius(m)
D
E
Radius (m^2) Co(1/m^2)
го
r 1
0.396
0.156816 6.3769
0.658
0.432964 2.309661
r 2
0.846
0.715716 1.397202
r_3
0.993
0.986049 1.014148
r4
1.122
1.258884 0.794354

Transcribed Image Text:Details
For data analysis, please complete as follows:
Given that,
(R-R)
f
Eq. 1
where:
R is the true value of the linear Radius of the kth ring
.Ro is the true value of the linear radius of the innermost ring
f-50 mm and is the listed value for the focal length of the camera lens
k-1, 2, 3... and is the rings formed through constructive interference of light waves emitted by the mercury lamp light source
A-546.1 nm and is the wavelength of the light emitted by the mercury lamp light source.
d-1.995 mm and is the distance between the parallel plates of the Fabry Perot Interferometer
It also should be noted that the observed values for the radii of the rings (innermost and kth rings) are not calibrated and, as such, have an unknown scale factor applied to them. The first portion of our analysis is to solve for this scale factor, considering the following.
Rk=S.Tk
Eq. 2
Eq. 3
Ro= S.To
R-RS (-) Eq. 4
Where:
.S is the scaling factor
⚫rk is the observed, scaled value of the linear Radius of the kth ring
⚫ro is the observed, scaled value of the linear radius of the innermost ring
Combining Eq. 4 with Eq. 1 gives you:
5(1-7)
f
-k
44
-k
Eq. 5a
Eq. 5b
where the difference of the squares of the observed scaled radii of the (kth and Oth) concentric rings form a linear relationship with the k. From this relationship, the scaled factor can be derived from the slope of the a graph of these values.
Please plot a scatter plot graph and obtain an equation corresponding with a linear trend line to find the scale factor S. Once that S is obtained, please use that value to find Ro and R, the true values of ring radii (i.e. using Eqs. 2 and 3).
Use this information to solve for the focal length of the camera by creating a second scatter plot graph that includes the value of the focal length in its slope. Please note that R,² forms a linear relationship with k in the following equation.
R=k+ R
Eq. 6
With the given values of X and d along with the nominal value of f, please provide a percentage difference between the nominal value of f and its experimental value.
Also from this second graph, find the percentage difference between the previously calculated value of RO and the one that is indicated by the trendline of the second graph (via the y intercept).
Expert Solution
This question has been solved!
Explore an expertly crafted, step-by-step solution for a thorough understanding of key concepts.
Step by stepSolved in 2 steps with 4 images

Knowledge Booster
Similar questions
- Please do not rely too much on chatgpt, because its answer may be wrong. Please consider it carefully and give your own answer. You can borrow ideas from gpt, but please do not believe its answer.Very very grateful!Please do not rely too much on chatgpt, because its answer may be wrong. Please consider it carefully and give your own answer. You can borrow ideas from gpt, but please do not believe its answer.Very very grateful!arrow_forwardGiven a relative uncertainty of 0.067, determine the absolute uncertainty of a time measurement of 4.025 seconds. Report the time as a confidence interval. (give me the confidence interval, and if you needed to calculate anything, tell me what you did.)arrow_forwardGiven that L* = L,±iL, and L+Ym (0, 0) = NËYm÷1 (0, 0), where N = h/(e+1+m) (l = m), %3D show that, L+ + L- L+ - L- (a) L, = and L, 2 2i (b)L,Y10 (0, 6) = cY1 (0,6) + c„Y1-1 (0, 6) and find the constants e and c2. (c)Consider the function (0,6), which has the expansion 1 v (0, 6) = E amYım (0,9), where ao = 2v2, a1 = a-1 = 2. %3D m=-1 Show that (0, 0) is an eigenfunction of L, and find the corresponding eigenvalue.arrow_forward
- Problems Q1: Calculate electrons and holes concentration in a germanium sample If T=300 K, Na-5×10¹%/m³, N₁-0. Assume that n=2.4×10¹⁹/m³. (Ans: 5.97×10¹⁹/m³, 9.65×10¹8/m³)arrow_forwardfrom 7/2 to TI from (–10) to (10) (2a) The average of f(x) = cos(3x) (2b) The average of f(x) = x² (2c) The average of f(x) = 2x sin(x) (2d) The average of f(x) = 3x from 0 to ↑ %3D from (-3) to (3)arrow_forwardCalculate the standard uncertainty in z if z=Xsinθ using the angle (45.00 ± 0.74) degrees and the value X = (23.60 ± 0.51) z = ___±___arrow_forward
- If the radius of a calcium ion is 0.27 nm, how much energy does it take to singly ionize it? Give your answer in electron-volts (eV) with precision 0.1 eV. Give your answer to 2 significant digits.arrow_forwardCalculate the standard uncertainty in z ifz=sinθusing the angle (46.60 ± 0.13) degreesz = __± __arrow_forwardCalculate the standard uncertainty in z ifz=sinθusing the angle (46.60 ± 0.13) degreesz = __± __arrow_forward
- Problem 1 Use the properties of Gamma functions to solve these expressions by hand. a program such as a T[ ] × [4] b C 3 — 92 xr 5 9 T[-2] × [2] Г xr 4 4arrow_forwardIf A =〖yz〗^2 i-3xz^2j +2xyz k, B = 3xi +4zj -xyk and ∅= xyz, findd^2/dxdy [Ax (B.∅)] at P(1, 1, 1)arrow_forwardcalculate: (a) the average of fex) = Cos (3x) from II to TT (い th average of f(x) = x² from (-10) to (l0) (c) th average of frxl = 3x from (-3) to (3)arrow_forward
arrow_back_ios
SEE MORE QUESTIONS
arrow_forward_ios