MATLAB: An Introduction with Applications
6th Edition
ISBN: 9781119256830
Author: Amos Gilat
Publisher: John Wiley & Sons Inc
expand_more
expand_more
format_list_bulleted
Question
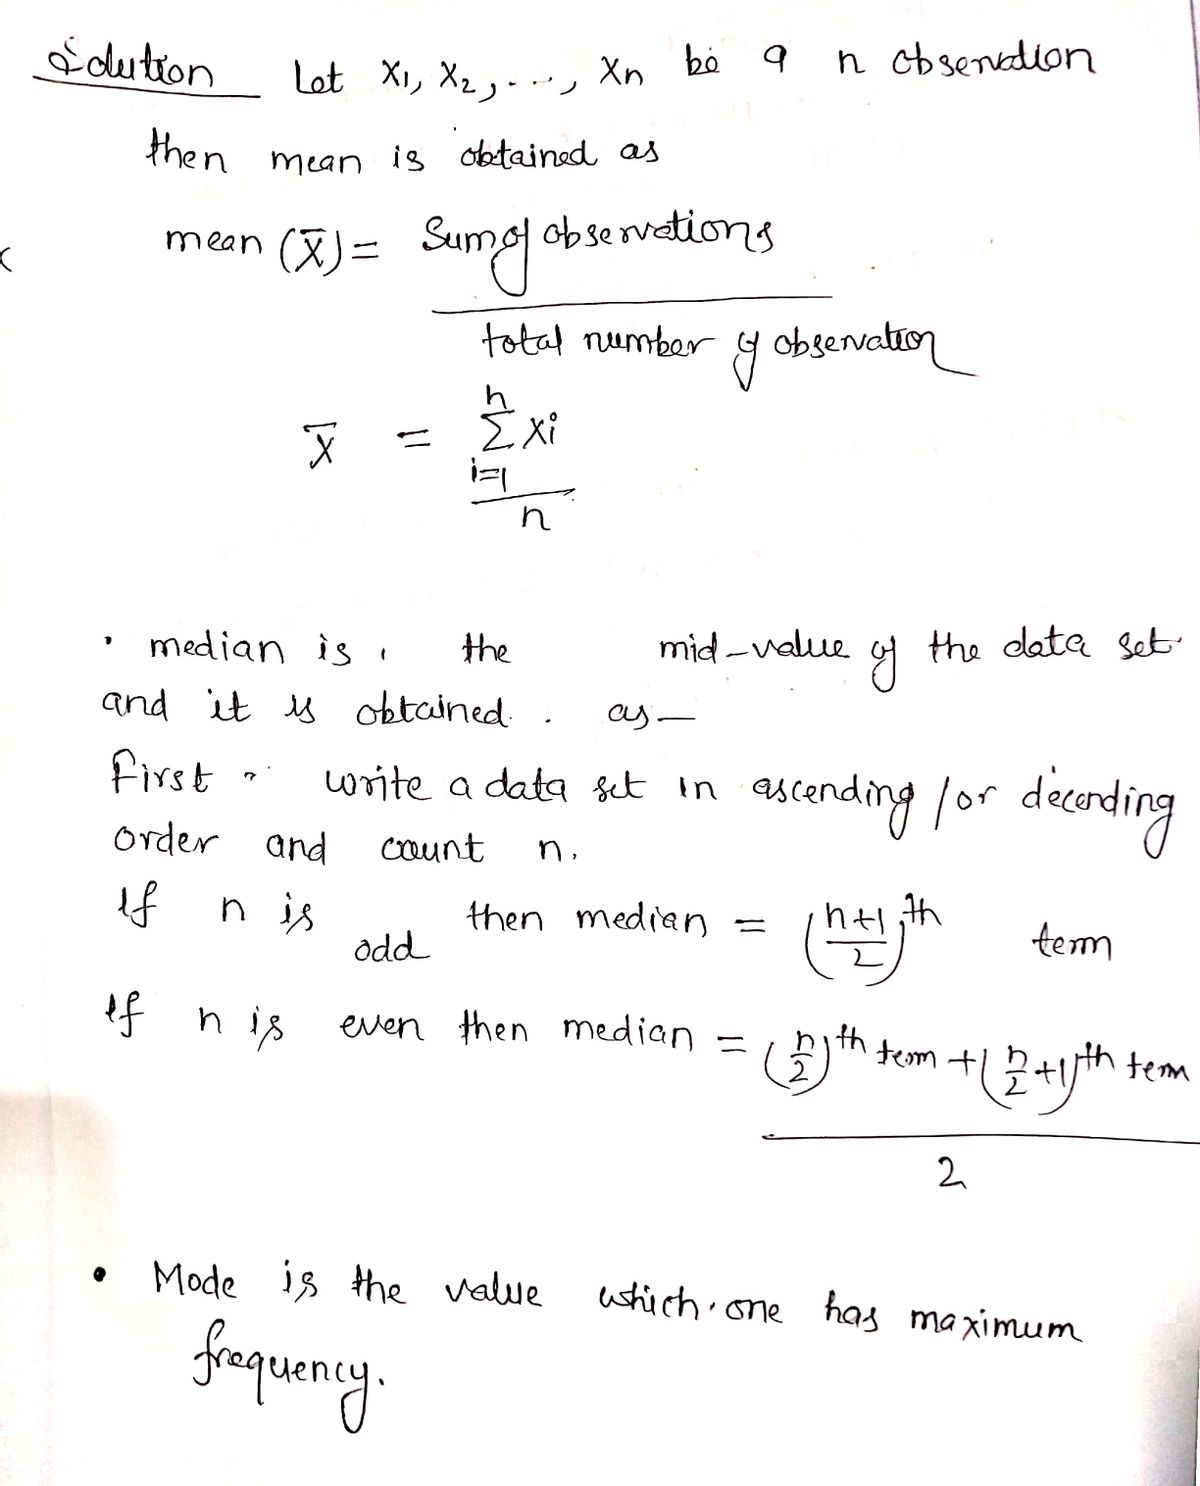
- Mean
Median Mode - Standard deviation
- Variance
Expert Solution
arrow_forward
Step 1

Step by stepSolved in 2 steps with 2 images

Knowledge Booster
Similar questions
- What is the median? For sugary drinksarrow_forwardshould have the right to marry. (The 2014 data were collected before the 2015 U.S. C2. GSS 2014 and GSS 2018 respondents were asked their opinion on whether homosexuals 30 measured on a 5-point scale from strongly agree (1) to strongly disagree (5). Supreme Court decision granting same-sex couples the right to marry. Responses wer measured on a 5-point scale from strongly agree (1) to strong!y aisagiee (2). Cumulative Percentage Homosexuals Should Have Right to Marry (2014) Percentage Frequency 32.5 32.5 Strongly agree 251 57.5 25.2 Agree 195 67.3 Neither agree nor disagree 9.6 74 79.2 Disagree 92 11.9 100.0 Strongly disagree 161 20.8 Total 773 100.0 Homosexuals Should Have Cumulative Right to Marry (2018) Frequency Percentage Percentage Strongly agree 293 39.5 39.5 Agree 200 27.0 66.5 Neither agree nor disagree 70 9.4 75.9 Disagree 67 9.0 84.9 Strongly disagree 111 15.0 99.9 Total 741 99.9 a. What is the level of measurement for this variable? b. What is the mode for 2014? For 2018?arrow_forwardExplain what the difference is between the height data between these two populations. (think about the mean versus variation aspects; is the mean the same? is the variation the same?)arrow_forward
- In Exercises, we have provided simple data sets for you to practice the basics of finding a a.population mean.b.population standard deviation.1, 9, 8, 4, 3arrow_forwardThe mean scores for students in a statistics course (by major) are shown below. What is the mean score for the class? 9 engineering majors: 90 5 math majors: 94 13 business majors: 76 The class's mean score is________ (Type an integer or a decimal rounded to two decimal places as needed.)arrow_forwardStatistics that describe typical scores are called: Select one: a. Models b. Standard deviations c. Z scores d. Measures of central tendencyarrow_forward
- The following refer to the following data set: 43 49 26 76 96 66 35 49 81 73 What is the mean (¯xx¯) of this data set?mean = (Please show your answer to one decimal place.)What is the median of this data set?median = What is the mode of this data set?mode =arrow_forwardThe following refer to the following data set: 20 28 44 92 64 48 68 43 86 43 What is the mean (7) of this data set? mean = (Please show your answer to one decimal place.) What is the median of this data set? median = %3D What is the mode of this data set? mode = %3Darrow_forwardThe scores and their percent of the final grade for a statistics student are given. What is the student's weighted mean score? The student's weighted mean score is (Simplify your answer. Round to two decimal places as needed.) Homework Quiz Quiz Project Final Exam Score Percent of final grade 86 10 83 10 98 10 98 40 89 30arrow_forward
- The following questions refer to this data set: 39 72 84 34 20 87 26 59 85 85 What is the mean of this data set? mean = (Round your answer to one decimal place if necessary.) What is the median of this data set? median = What is the mode of this data set? mode =arrow_forwardFind the mean of the data summarized in the given frequency distribution table below. Score students 50-59 5 60-69 8 70-79 5 80-89 5 90-99 17arrow_forwardCalculation of a mean is most appropriate for which of the following sets of data? Attitudes of graduate nurses toward the elderly measured by axillary temperature Ranking of nursing students by clinical instructors according to perceived technical ability. Percent of nurses in each specialty area.arrow_forward
arrow_back_ios
SEE MORE QUESTIONS
arrow_forward_ios
Recommended textbooks for you
 MATLAB: An Introduction with ApplicationsStatisticsISBN:9781119256830Author:Amos GilatPublisher:John Wiley & Sons Inc
 Probability and Statistics for Engineering and th...StatisticsISBN:9781305251809Author:Jay L. DevorePublisher:Cengage Learning
 Statistics for The Behavioral Sciences (MindTap C...StatisticsISBN:9781305504912Author:Frederick J Gravetter, Larry B. WallnauPublisher:Cengage Learning
 Elementary Statistics: Picturing the World (7th E...StatisticsISBN:9780134683416Author:Ron Larson, Betsy FarberPublisher:PEARSON
 The Basic Practice of StatisticsStatisticsISBN:9781319042578Author:David S. Moore, William I. Notz, Michael A. FlignerPublisher:W. H. Freeman
 Introduction to the Practice of StatisticsStatisticsISBN:9781319013387Author:David S. Moore, George P. McCabe, Bruce A. CraigPublisher:W. H. Freeman

MATLAB: An Introduction with Applications
Statistics
ISBN:9781119256830
Author:Amos Gilat
Publisher:John Wiley & Sons Inc

Probability and Statistics for Engineering and th...
Statistics
ISBN:9781305251809
Author:Jay L. Devore
Publisher:Cengage Learning

Statistics for The Behavioral Sciences (MindTap C...
Statistics
ISBN:9781305504912
Author:Frederick J Gravetter, Larry B. Wallnau
Publisher:Cengage Learning

Elementary Statistics: Picturing the World (7th E...
Statistics
ISBN:9780134683416
Author:Ron Larson, Betsy Farber
Publisher:PEARSON

The Basic Practice of Statistics
Statistics
ISBN:9781319042578
Author:David S. Moore, William I. Notz, Michael A. Fligner
Publisher:W. H. Freeman

Introduction to the Practice of Statistics
Statistics
ISBN:9781319013387
Author:David S. Moore, George P. McCabe, Bruce A. Craig
Publisher:W. H. Freeman