
A First Course in Probability (10th Edition)
10th Edition
ISBN: 9780134753119
Author: Sheldon Ross
Publisher: PEARSON
expand_more
expand_more
format_list_bulleted
Related questions
Question
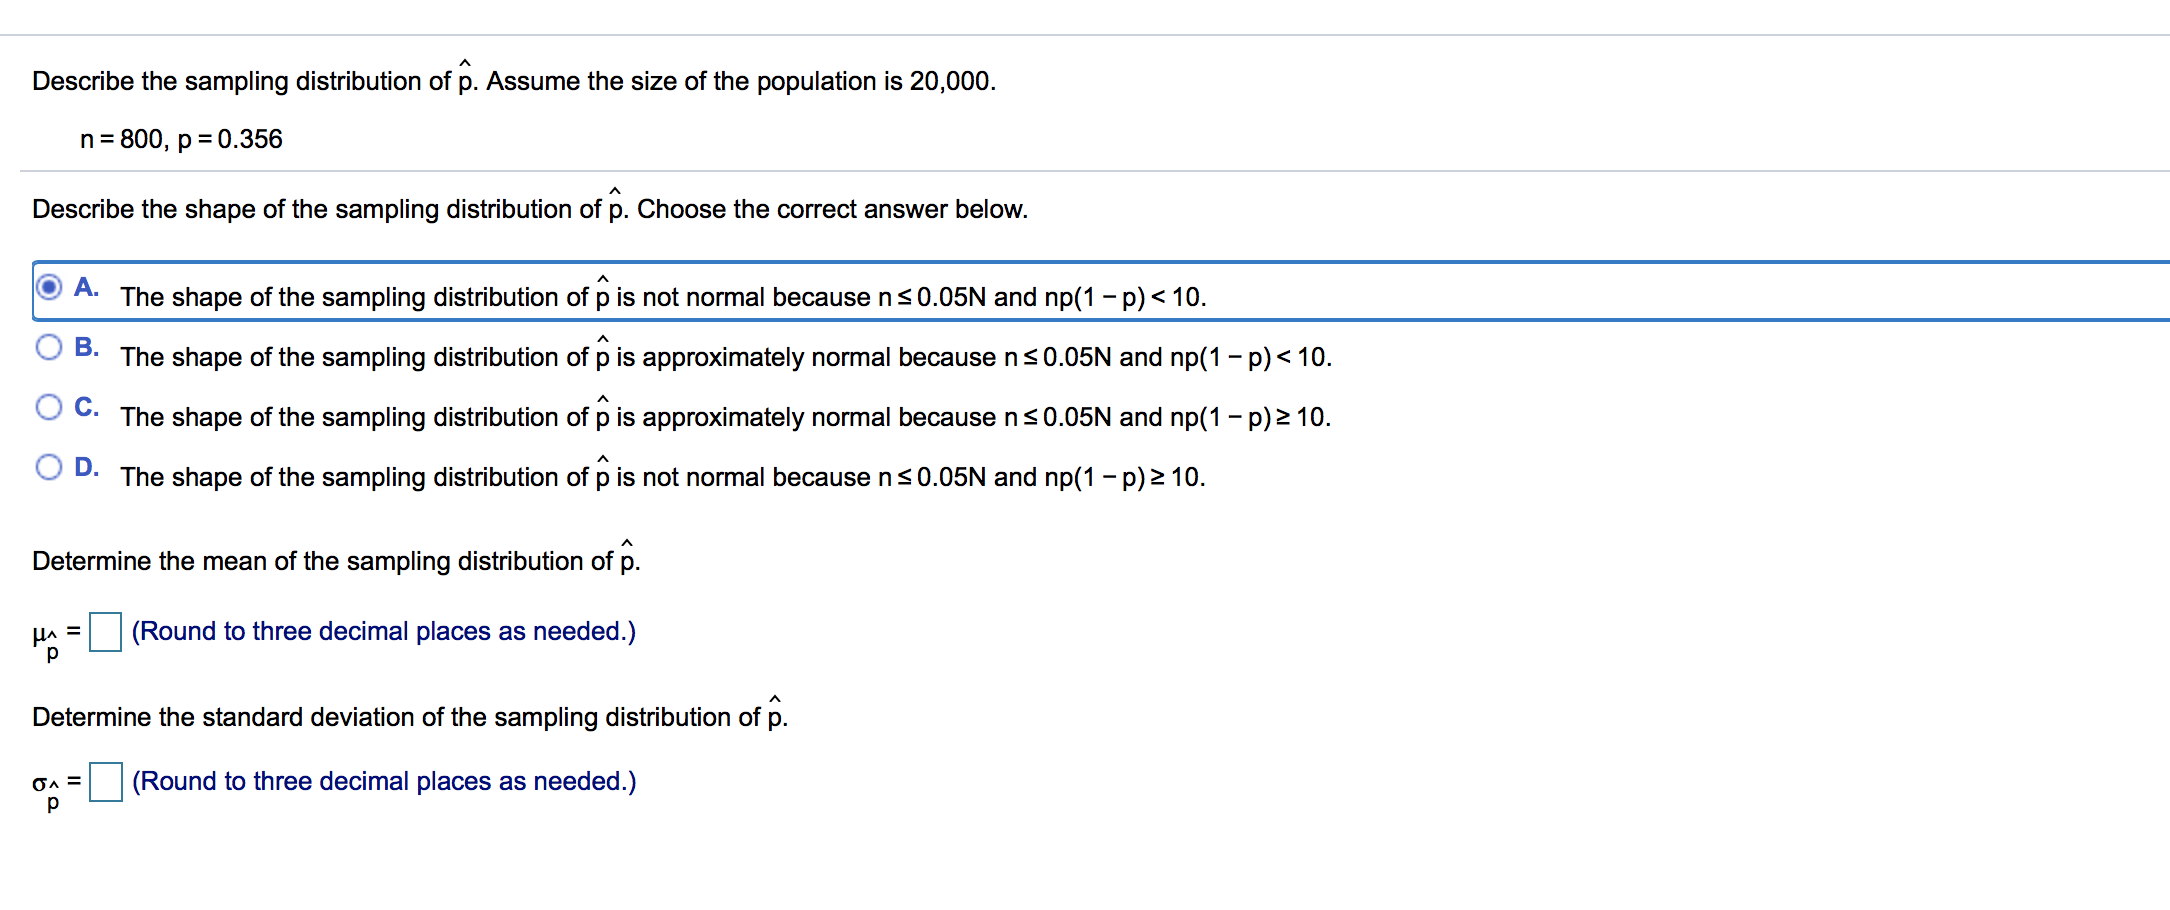

Transcribed Image Text:Describe the sampling distribution of p. Assume the size of the population is 20,000.
n 800, p 0.356
Describe the shape of the sampling distribution of p. Choose the correct answer below.
A.
The shape of the sampling distribution of p is not normal because n s 0.05N and np(1 - p)< 10
В.
The shape of the sampling distribution of p is approximately normal because ns0.05N and np(1 -p) 10
A
С.
The shape of the sampling distribution of p is approximately normal because ns0.05N and np(1 -p)2 10
D.
The shape of the sampling distribution of p is not normal because ns 0.05N and np(1 -p)z 10.
Determine the mean of the sampling distribution of p.
(Round to three decimal places as needed.)
HA
р
Determine the standard deviation of the sampling distribution of p.
(Round to three decimal places as needed.)
р
Expert Solution
This question has been solved!
Explore an expertly crafted, step-by-step solution for a thorough understanding of key concepts.

This is a popular solution

Trending nowThis is a popular solution!

Step by stepSolved in 4 steps with 4 images

Knowledge Booster

Similar questions
- The data represent the age of world leaders on their day of inauguration. Find the five-number summary, and construct a boxplot for the data. Comment on the shape of the distribution. draw the correct boxplot of the data given Whats the correct description of the shape of the distribution.arrow_forwardAssume that a randomly selected subject is given a bone density test. Those test scores are normally distributed with a mean of 0 and a standard deviation of 1. Find the probability that a given score is between - 2.18 and 3.86 and draw a sketch of the region. Sketch the region. Choose the correct graph below. O A. В. OC. O D. -2.18 3.86 2.18 3.86 -2.18 3.86 -2.18 3.86 The probability is (Round to four decimal places as needed.) Click to select your answer(s). 山T00④ NOV 2. 1377 14 X P W MacBook Air esc 80 888 F3 F4 F7 FB F9 F10 $4 & 4 80 Q E Y A F G H. K /2x cv C V B D. 林 wwww wwwwwarrow_forwardFind the mean for the data items in the given frequency distribution. 6. 8. Score, x Frequency, f 3 1 The mean IS Round to 3 decimal places as needed.) 55 4/3 3/5 26 1.arrow_forward
- Solve it correctly please. I will rate accordingly with 4votes.arrow_forwardFind the margin of error for the given values of c, s, and n. c = 0.99, s 6, n = 13 Click the icon to view the t-distribution table. The margin of error is (Round to one decimal place as needed.)arrow_forwardFind the margin of error for the given values of c, s, and n. c= 0.98, s = 4, n = 28 Click the icon to view the t-distribution table. The margin of error is (Round to one decimal place as needed.)arrow_forward
- Find the margin of error for the given values of c, s, and n. c%3D0.95, s%3D3.6 , n 16 F Click the icon to view the t-distribution table. The margin of error is (Round to one decimal place as needed.) Get more help-arrow_forwardLet sample size n = 51. Find P (t > 4.92). a. 0.0005 < P (t > 4.92) < 0.001 b. 0.001 < P (t > 4.92) < 0.0025 c. P (t > 4.92) < 0.0005 d. P (t > 4.92) > 0.25arrow_forwardq6arrow_forward
- Plz help asap 5.arrow_forwardShow your solution clearly.arrow_forwardAssume that the readings on the thermometers are normally distributed with a mean of 0° and standard deviation of 1.00°C. A thermometer is randomly selected and tested. Draw a sketch and find the temperature reading corresponding to P34, the 84th percentile. This is the temperature reading separating the bottom 84% from the top 16%. Click to view page 1 of the table. Click to view page 2 of the table. Which graph represents P ? Choose the correct graph below. 84 A. В. OC. D. Ay X The temperature for P84 is approximately (Round to two decimal places as needed.)arrow_forward
arrow_back_ios
arrow_forward_ios
Recommended textbooks for you
- A First Course in Probability (10th Edition)ProbabilityISBN:9780134753119Author:Sheldon RossPublisher:PEARSON

A First Course in Probability (10th Edition)
Probability
ISBN:9780134753119
Author:Sheldon Ross
Publisher:PEARSON